Microbial Decolorization of Azo Dyes ̶ A Mini Review
- Author(s): Saraschandra Naraginti and A. Sivakumar
- Category: HTML FullText
- Published: 02 February 2017
Ag and Au Nanoparticles: Green Synthesis, Catalytic and Bacterial Activity Studies
Saraschandra Naragintia,b and A. Sivakumara,*
aChemistry Division, School of Advanced Sciences, VIT University, Vellore - 632014, India.
bKey Laboratory of Integrated Regulation and Resource Development of Shallow Lakes, Ministry of Education, College of Environment, Hohai University, XiKang Road #1, Nanjing 210098, PR. China.
Published Online 05 01 2017
A rapid one step green synthetic method using kiwi fruit extract was employed for preparation of silver and gold nanoparticles. The synthesized nanoparticles were successfully used as green catalysts for the reduction of 4-nitrophenol (4-NP) and methylene blue (MB). They also exhibited excellent antimicrobial activity against clinically isolated Pseudomonas aeruginosa and Staphylococcus aureus. It was noticed that with increase in concentration of the aqueous silver and gold solutions, particle size of the silver and gold nanoparticles showed increase as evidenced from UV-Visible spectroscopy and TEM micrograph. The method employed for the synthesis required only a few minutes for more than 90% formation of nanoparticles when the temperature was raised to 80 °C. It was also noticed that the catalytic activity of nanoparticles depends upon the size of the particles. These nanoparticles were observed to be crystalline from the clear lattice fringes in the transmission electron microscopic (TEM) images, bright circular spots in the selected area electron diffraction (SAED) pattern and peaks in the X-ray diffraction (XRD) pattern. The Fourier-transform infrared (FTIR) spectrum indicated the presence of different functional groups in the biomolecule capping the nanoparticles.
INTRODUCTION
Nanoparticles are known to exhibit characteristic features depending on their size, morphology1 and these features make them good antibacterial and antifungal agents.2–5 It is expected that these unique features of nanoparticles would play a crucial role in biomedicine, energy science, catalysis, optics and other health care applications.6 Methods such as chemical reduction,7 electrochemical reduction,8 photochemical reduction9 and heat evaporation10 have all been employed for synthesis of nanoparticles by different researchers. All these methods do successfully produce the metal nanoparticles but have disadvantages such as high process cost and pollute the environmental because of usage of toxic organic solvents and reducing agent. To avoid these issues, green chemistry approaches have been employed for their production11–15 which are simple, convenient, less energy-intensive, eco-friendly and minimize the usage of unsafe materials and maximize the efficiency of the process.
4-nitrophenol (4-NP), listed by the US EPA as a major pollutant,16 has been used extensively as a raw material for the manufacture of pesticides, herbicides, synthetic dyes, pharmaceuticals, for treatment of leather and in several military applications.17 Since the nitro group in nitrophenols is comparatively static in biological systems, it could cause health hazards in humans and animals, making it necessary to develop efficient methods for its degradation in environmental samples. This would pave way for degrading hazardous phenolic compounds in water wastes, soil and air which are primary causes of serious health issues in human beings.18,19 MB is a thiazine dye, used for trace levels analysis of sulphide ions in aquatic samples. The cationic form of MB is used as an anti-malarial agent and chemotherapeutic agent in the aqua culture industry. Moreover, it is used in microbiology, surgery and diagnostic field.20,21
4-nitrophenol and methylene blue have been degraded using different physical and chemical methods employing adsorption, photocatalysis, UV irradiation, microwave, electro catalysis, and fenton reaction, which are energy consuming and require organic solvents. Biological methods have also shown poor degradation on 4-nitrophenol reduction.22,23 This made researchers to discover green catalysts for degradation of 4-nitrophenol and methylene, though few reports are available for green catalysis,24,25 it would be appropriate to develop more efficient and cost-effective methodology for their degradation via an eco-friendly approach. Few reports are also available for bactericidal activity of Ag, Au and other metal nanoparticles produced using various plant extracts.26–32
The present study reports a novel attempt of synthesizing gold and silver nanoparticles using kiwi fruit extract for catalytic reduction of two organic pollutants. Different reactions conditions such as temperature and volume of fruit extract on the formation of nanoparticles were also studied. Simultaneously, the bactericidal activity of the synthesized nanoparticles against clinically isolated pathogenic microorganisms was also investigated.
MATERIALS AND METHODS
Chemicals
Silver nitrate (AgNO3) and Chloroauric acid (HAuCl4) were purchased from Sigma-Aldrich chemicals and kiwi fruits were procured from local market. Millipore water was used in all experiments.
Bacterial Pathogens
Clinically isolated bacterial strains Pseudomonas aeruginosa (P. aeruginosa) and Staphylococcus aureus (S. aureus) from patient blood samples have been obtained from Santhiram Medical College & General Hospital, Nandyal, India.
Preparation of Fruit Extract
The kiwi fruit extract was prepared by taking 100 g of the peeled fruit which was ground well, filtered through Whatmann filter paper and centrifuged at 4000 rpm for 10 min. The extract was stored at 4 °C for further use.
Green Synthesis of Silver and Gold Nanoparticles
1 mL of fruit extract was added to 9 mL of silver nitrate or chloroauric acid (1 x 10⁻³M ) and the reaction mixture was placed at 80 °C till the color turned to characteristic yellow and ruby-red respectively indicating the formation of silver nanoparticles (Ag NPs) and gold nanoparticles (Au NPs). Both the reactions were carried out at five different concentrations in the range of 1 x 10⁻³ M to 3 x 10⁻³ M each of silver nitrate (S1 to S5) and chloroauric acid (G1 to G5) solutions. These reactions were also carried out at two other temperatures, 30 °C and 60 °C to study rate of the formation of the nanoparticles.
Characterization of Nanoparticles
The formation of Ag NPs and Au NPs using fruit extract as reducing agent was monitored by periodically measuring the absorbance of the solution on the UV–Vis spectrophotometer (JASCO V – 670) till the solutions showed permanent yellow and ruby red colour respectively. TEM imaging, SAED pattern and EDAX analysis were carried out using JEOL JEM 2100 high resolution transmission electron microscope (HR-TEM) with an accelerating voltage of 200 KV. XRD patterns were recorded for the centrifuged and dried samples using X–ray BRUKER D8 Advance X-ray diffractometer with Cu Kα source (λ=1.5406 A°). FT-IR spectrum was recorded using SHIMADZU, IRAffinity 1 spectrometer. A differential light scattering Malvern Zetasizer Nano ZS (Malvern Instruments Ltd., UK) instrument was used for zeta potential measurements.
Antibacterial Activity
The antibacterial activity of both nanoparticles against two pathogenic microorganisms, P. aeruginosa and S. aureus, which were clinically isolated, was studied by zone inhibition method using sterilized Muller Hinton agar. The inoculums from the isolates were spread on the plate using L-rod and wells were made in the agar using a cork borer. 10 µL, 20 µL and 30 µL of colloidal silver (S1) and gold (G1) nanoparticles were added into each one of these wells. The plates were incubated at 37 °C for 24 h in an aerobic incubation chamber and were visually analyzed for zones of inhibition.
Catalytic Reduction of 4-Nitrophenol and Methylene Blue
Catalytic reduction of 4-NP was studied by adding 100 µL of 1 x 10⁻² M 4-NP aqueous solution to 1.5 mL of freshly prepared 3 x 10⁻² M NaBH4 solution in a quartz cell (1.0 cm path length and 3 mL volume). Then, 25 µL of the synthesized Ag NPs (S1 & S5) or Au NPs (G1 & G5) solution was added to each one of these solutions. A JASCO V–670 spectrophotometer was employed to monitor the progress of the conversion of 4-NP to 4-AP at ambient temperature in the wavelength range of 200–550 nm.
For studying the degradation process of MB, 1 mL 0.05 M NaBH4 solution was added to 5 mL of 1 x 10⁻⁴M Methylene blue while stirring the solution for five minutes. Then, 4 mL of Ag (S1 & S5) or 4 mL of Au (G1 & G5) colloidal solutions were added to each one of the solutions and the stirring continued for five more minutes. MB (blue colour) in an oxidizing environment became colorless in the presence of NaBH4 and catalyst indicating its reduction to Leucomethylene Blue.
RESULTS AND DISCUSSION
Effect of Concentration of Metal ion Solution and Reaction Temperature
Fig.1 shows the UV–Visible spectra recorded during the formation of Ag NPs and Au NPs from different concentrations of AgNO3 and HAuCl4. When the reaction went to completion, yellow and ruby-red colors were observed in Ag and Au solutions respectively, indicating the formation of nanoparticles. Reddish yellow and groovy pink-ruby colours for Ag and Au nanoparticles are known to emerge from surface plasmon vibrations.33,34 Extinction spectra of silver hydrosol synthesized from different concentrations of AgNO3 and HAuCl4 have shown characteristic surface plasmon absorption bands at 425 nm for silver and at 538 nm for gold nanoparticles synthesized from 1.0 x 10⁻³M of AgNO3 (S1) and HAuCl4 (G1) using a fixed volume (1 mL) of the fruit extract. The SPR band showed a shift to higher wavelength with increasing concentration of silver nitrate from 1.0 x 10⁻³M to 3.0 x 10⁻³M
Table 1. Effect of concentration and reaction temperature on synthesis of nanoparticles using 1 mL of fruit extract.
|
S. No. |
Conc. of AgNO3 |
Time taken for formation of Ag NPs (Approx. in min) |
Conc. of HAuCl4 |
Time taken for formation of Au NPs (Approx. in min) |
||||
|
|
|
30 °C |
60 °C |
80 °C |
|
30 °C |
60 °C |
80 °C |
|
1 |
1.0 mM |
340 |
35 |
20 |
1.0 mM |
100 |
15 |
05 |
|
2 |
1.5 mM |
320 |
30 |
20 |
1.5 mM |
90 |
10 |
04 |
|
3 |
2.0 mM |
320 |
28 |
15 |
2.0 mM |
80 |
10 |
03 |
|
4 |
2.5 mM |
300 |
21 |
10 |
2.5 mM |
50 |
08 |
03 |
|
5 |
3.0 mM |
300 |
20 |
09 |
3.0 mM |
40 |
08 |
01 |
and the corresponding colour changes are observed from reddish yellow to brown; similarly the corresponding colour of the gold NPs was also observed to change from ruby-red to purple colour. The broadening as well as shift SPR band from 425 to 442 nm for silver NPs and 538 to 549 nm for gold NPs could be attributed to the increase in particle size which is also confirmed by the TEM micrographs. This kind of phenomenon has earlier been reported in the case of silver nanoparticles synthesized using seed extract of Jatropha curcas.35
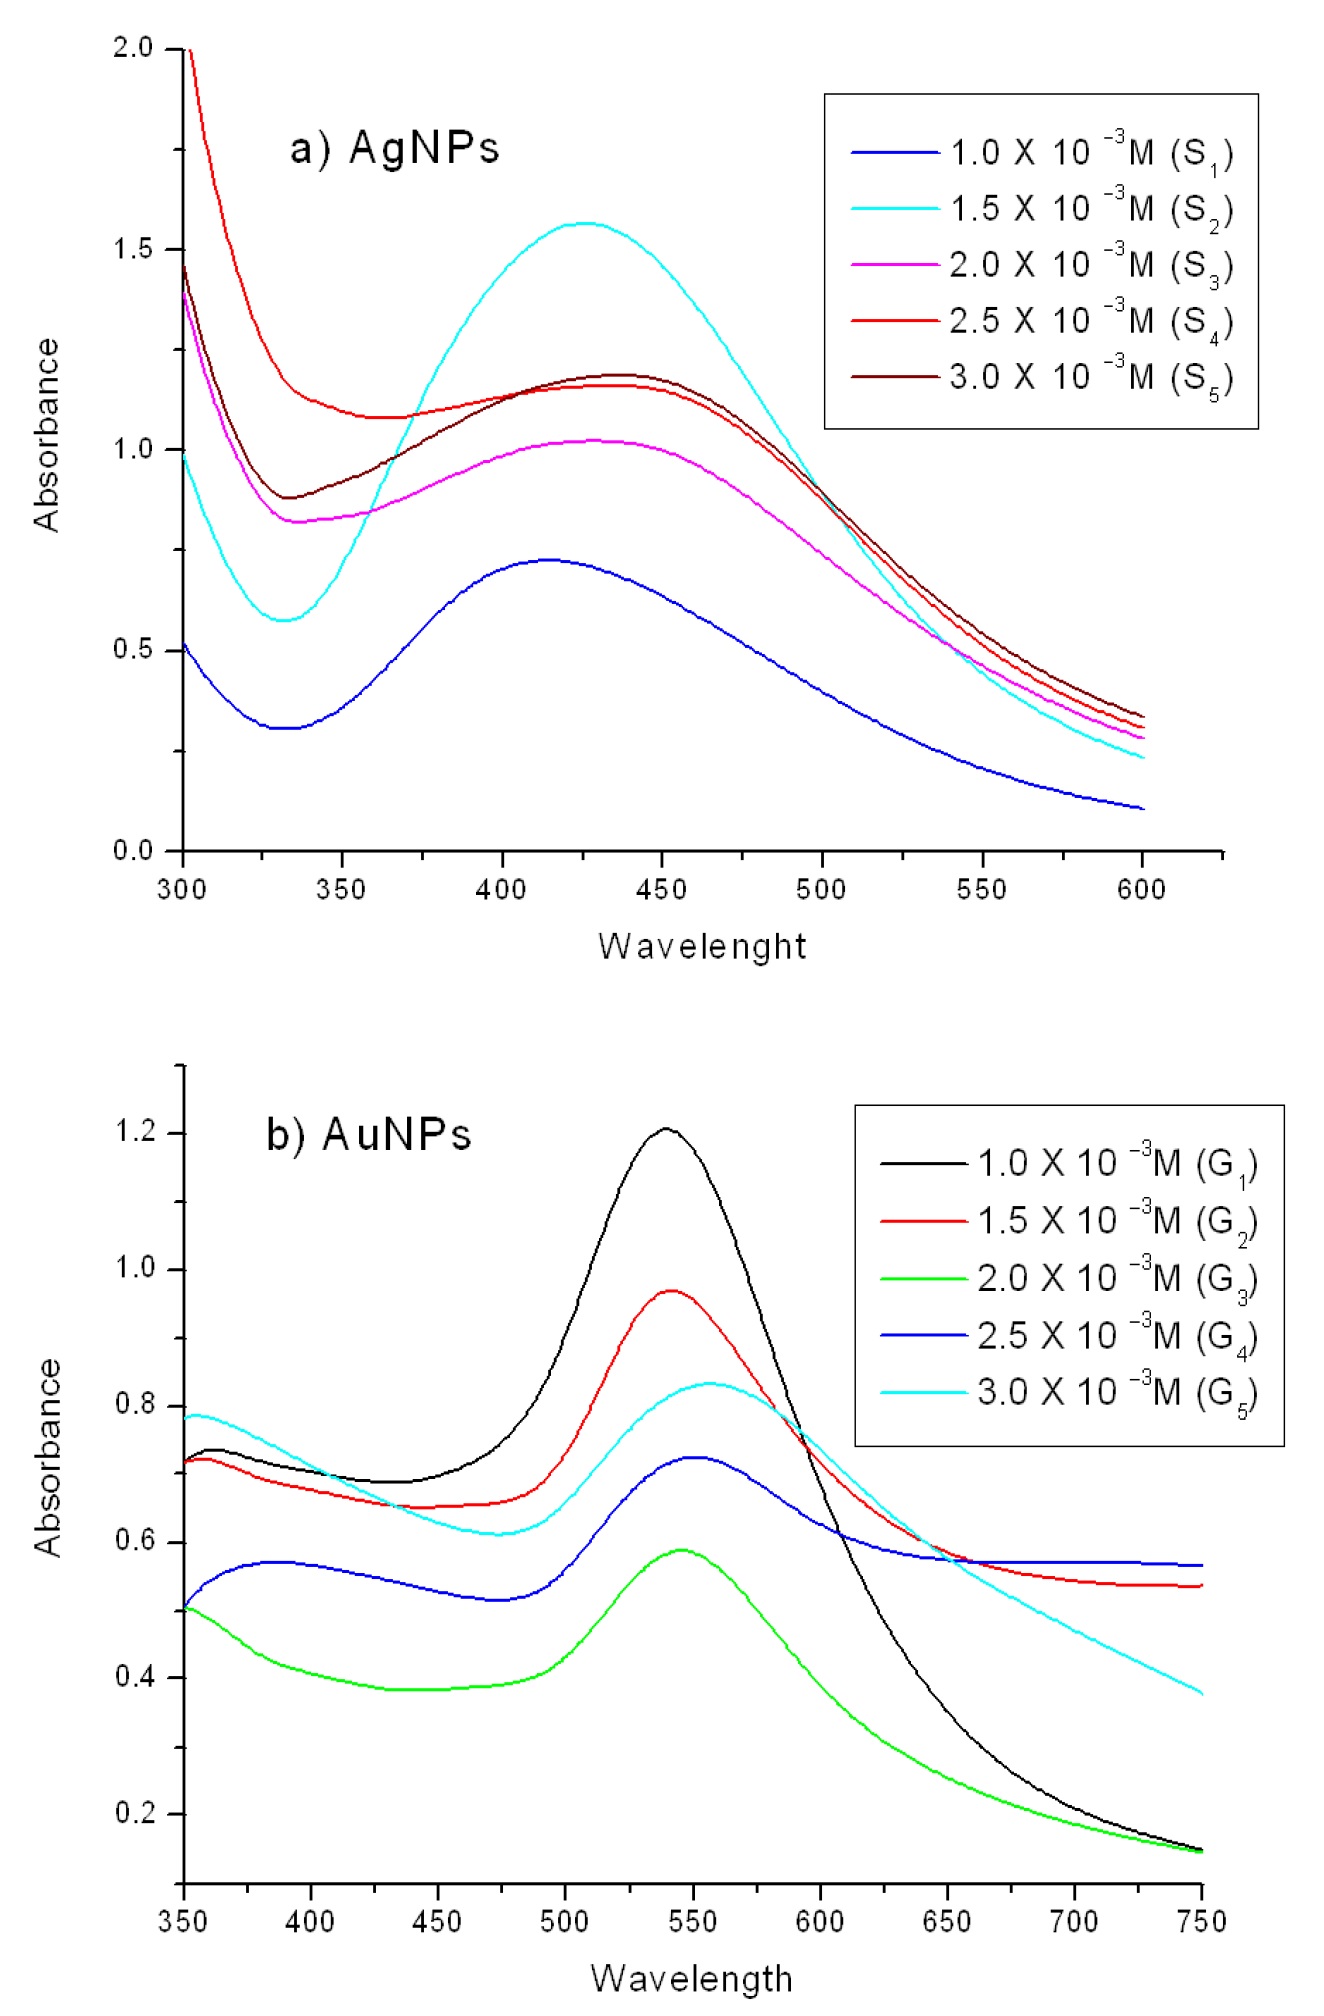
Figure 1. UV-Vis spectra of (a) silver and (b) gold nanoparticles at different concentration of AgNO3 and HAuCl4.
No shift in the wavelength of the absorption peaks was observed at fixed concentration of the metal salt solution during the reaction with extract at different temperatures (Fig. 2). When the reaction was carried out at 60 °C and 80 °C, the rate of formation of nanoparticles was observed to increase.
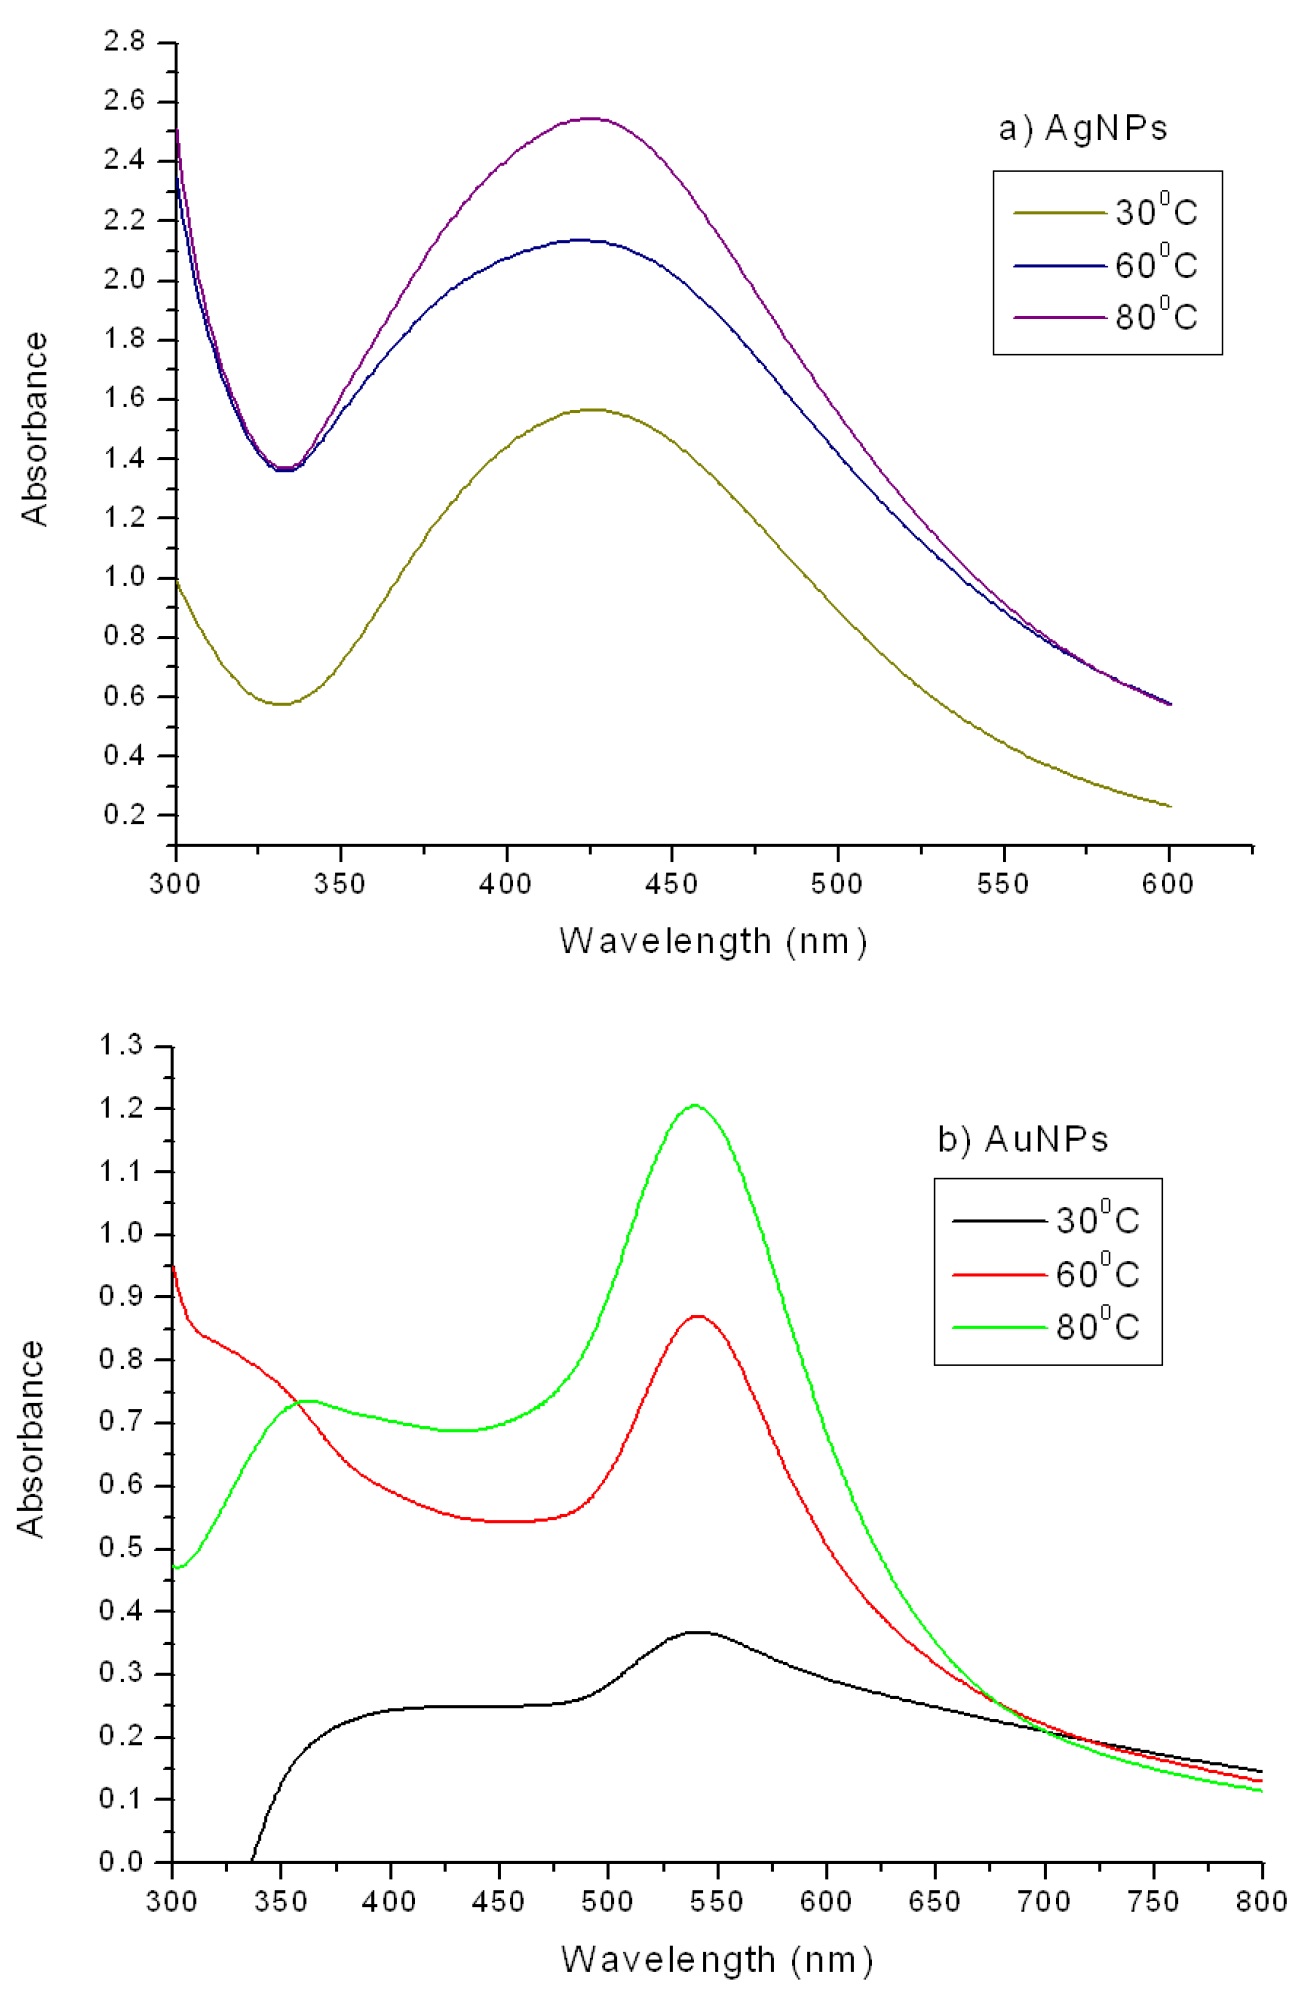
Figure 2. UV-Vis spectra of (a) silver and (b) gold nanoparticles at fixed concentration (1.0 X 10 -3M) during the reaction at different temperatures.
Table 1. gives data on time and temperature dependence of nanoparticle formation during the reaction. This illustrates that SPR band at 425 nm was observed for Ag NPs at 30 °C after 340 min but the same band appeared within 20 min when the reaction temperature was raised to 80 °C.
Similarly for Au NPs, the SPR band was observed at 538 nm at 30 °C in 100 min appeared within 5 min at 80 °C, which also indicating that the formation of gold nanoparticles at both the temperatures was faster than silver NPs, which could be attributed to the higher reduction potential of Au3+ ions than Ag+ ions,36 similar results have been reported during the synthesis of gold nanotriangles using lemongrass extract.37
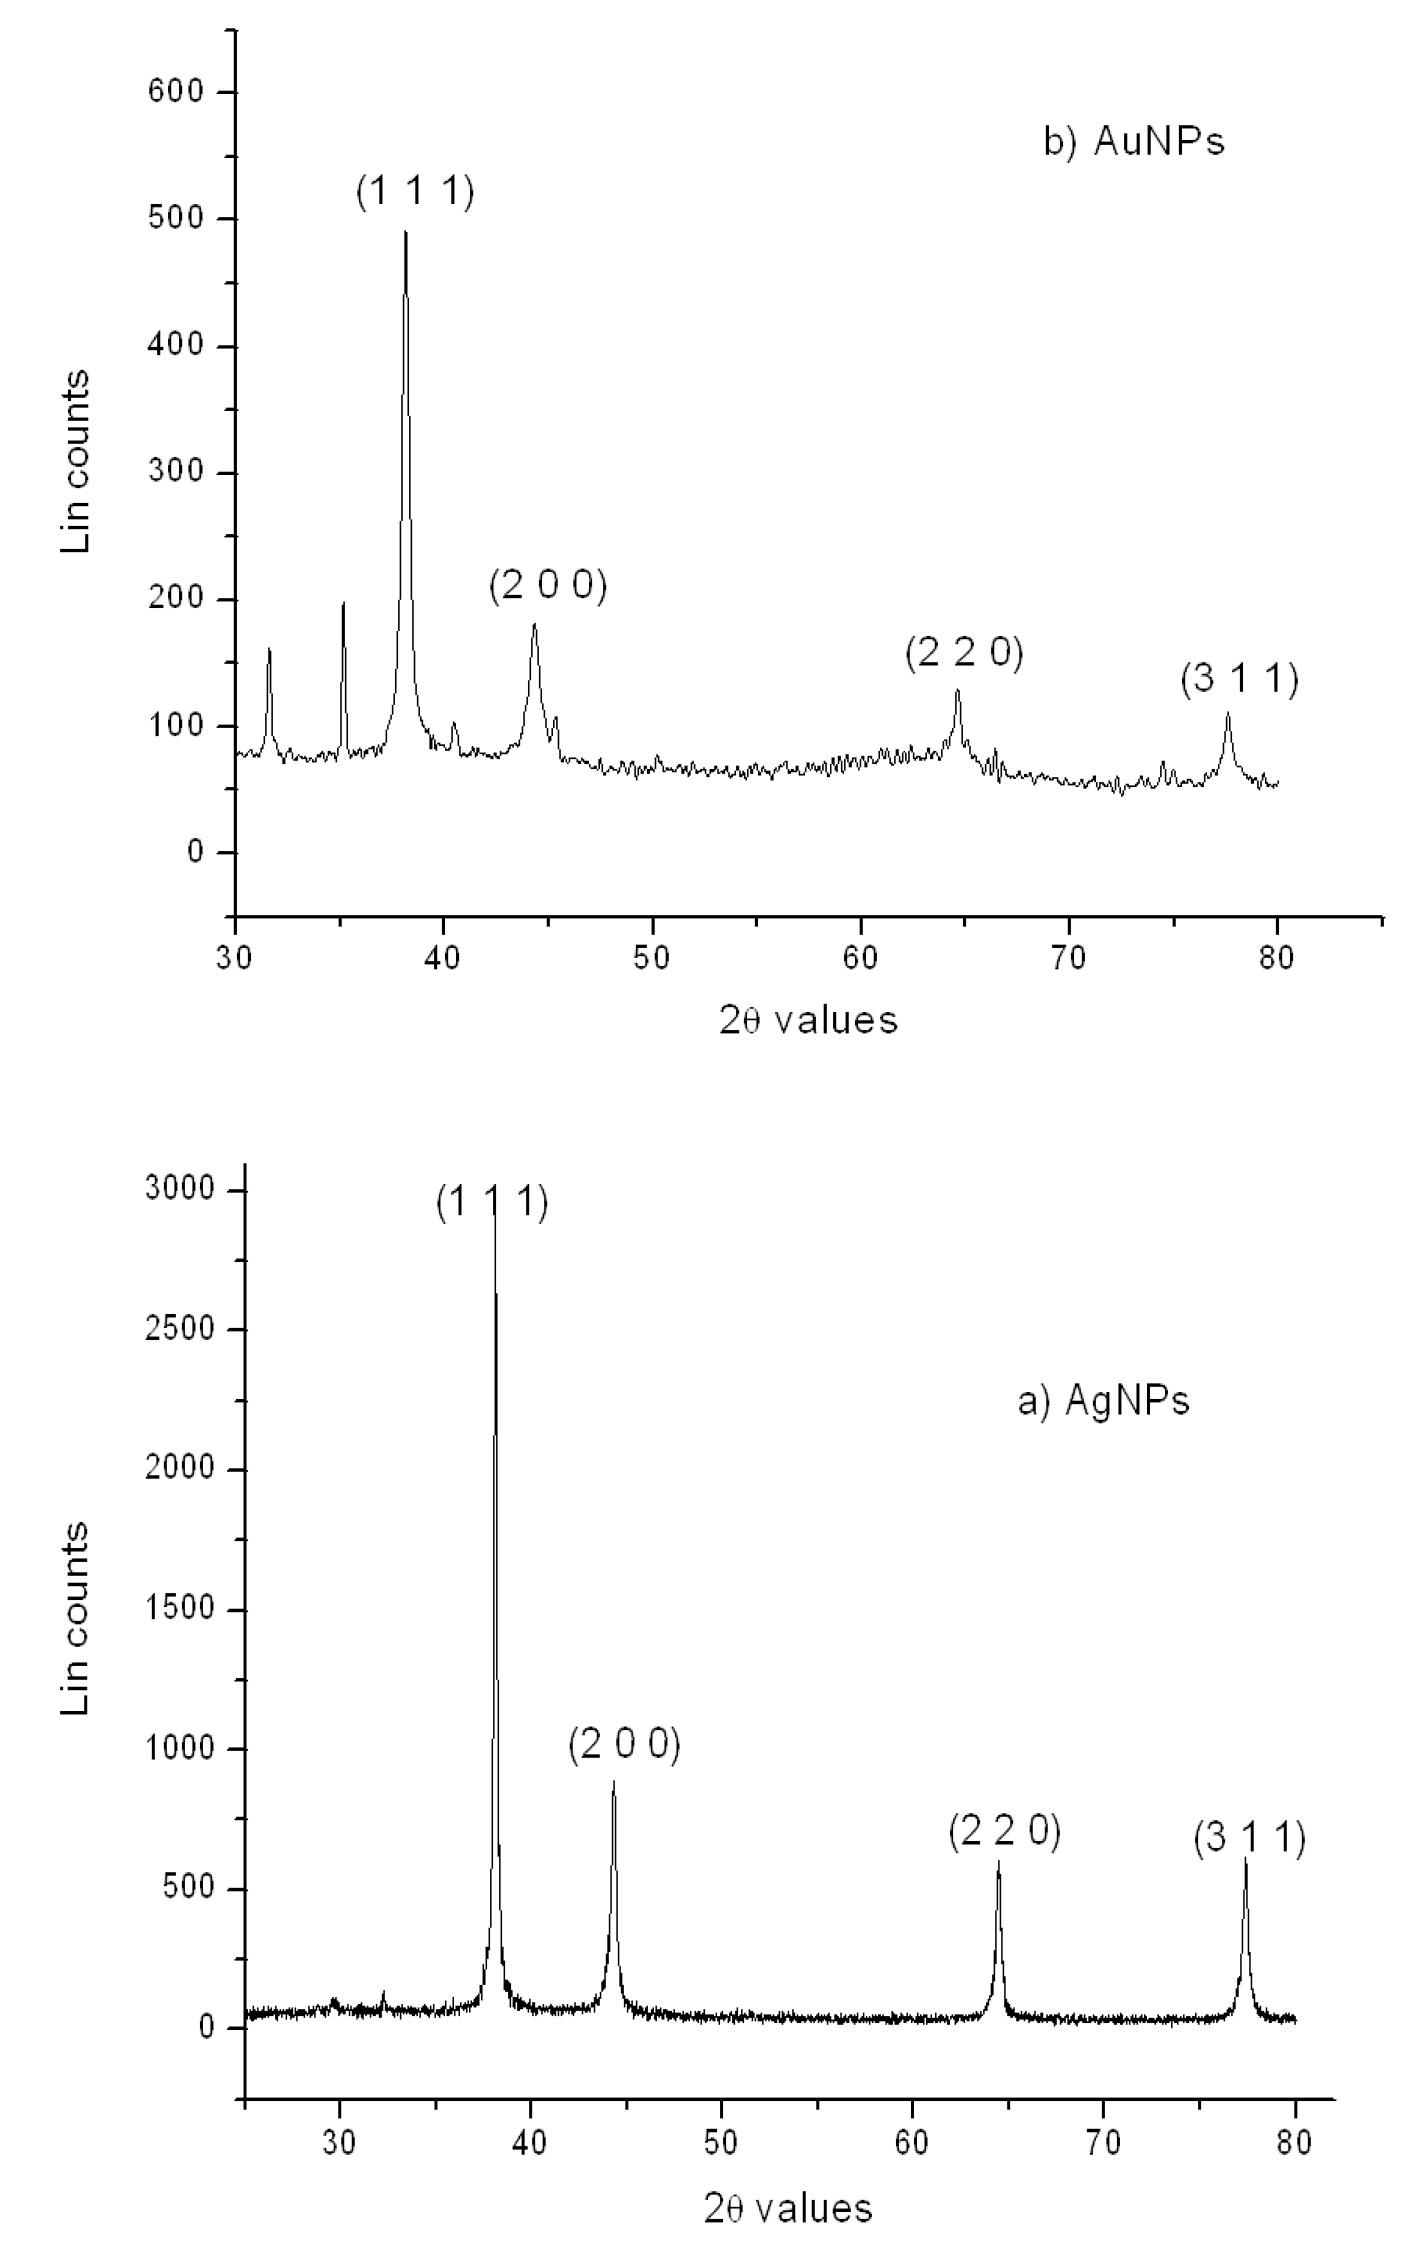
Figure 3. XRD pattern of the dried (a) silver and (b) gold nanoparticles.
X-ray Diffraction Analysis
The XRD pattern (Fig. 3) of the dried nanoparticles indicates their spherical crystalline structure as can be seen from the diffraction pattern. The patter also indicates that the nanoparticles synthesized are polydispersed and have different particle size. Characteristic face-centered cubic phase (JCPDS File No.87-0720) is confirmed by the diffraction peaks corresponding to (1 1 1), (2 0 0), (2 2 2) and (3 1 1) planes. The average size of the formed silver and gold NPs, as calculated using Debye–Scherrer equation were found to be around 35 nm and 20 nm respectively. The Bragg reflections (2 0 0), (2 2 0) and (3 1 1) were weak and broadened relative to intense (1 1 1) reflection which indicates that the nanocrystals are primarily oriented along (1 1 1) plane and have small particle size as confirmed by TEM micrographs.
TEM, EDX, Zeta Potential Analysis
TEM image of Ag NPs synthesized by treating 1.0 x 10⁻³M (S1) and 3.0 x 10⁻³M (S5) AgNO3 solutions with 1 mL of fruit extract is shown in Fig. 4 (a) & (b). These micrographs indicate that the silver NPs formed were predominantly spherical having diameters ranging from 25 to 40 nm and 30 to 45 nm respectively for S1 and S5. Particle sizes of the silver NPs synthesized using two different concentrations of AgNO3 are in complete agreement with the observed SPR bands at 425 and 442 nm respectively. Similarly TEM images of Au NPs synthesized from 1.0 x 10⁻³M (G1) and 3.0 x 10⁻³M (G5) HAuCl4 shown in Fig. 5 (a) & (b), indicate that the average particle size has a range between 7 nm to 20 nm and 15 nm to 35 nm respectively for G1 and G5, which is in agreement with the observed SPR bands at 538 and 549 nm. Insets of TEM images show the selected area electron diffraction (SAED) pattern confirming the polycrystalline nature of the synthesized nanoparticles.
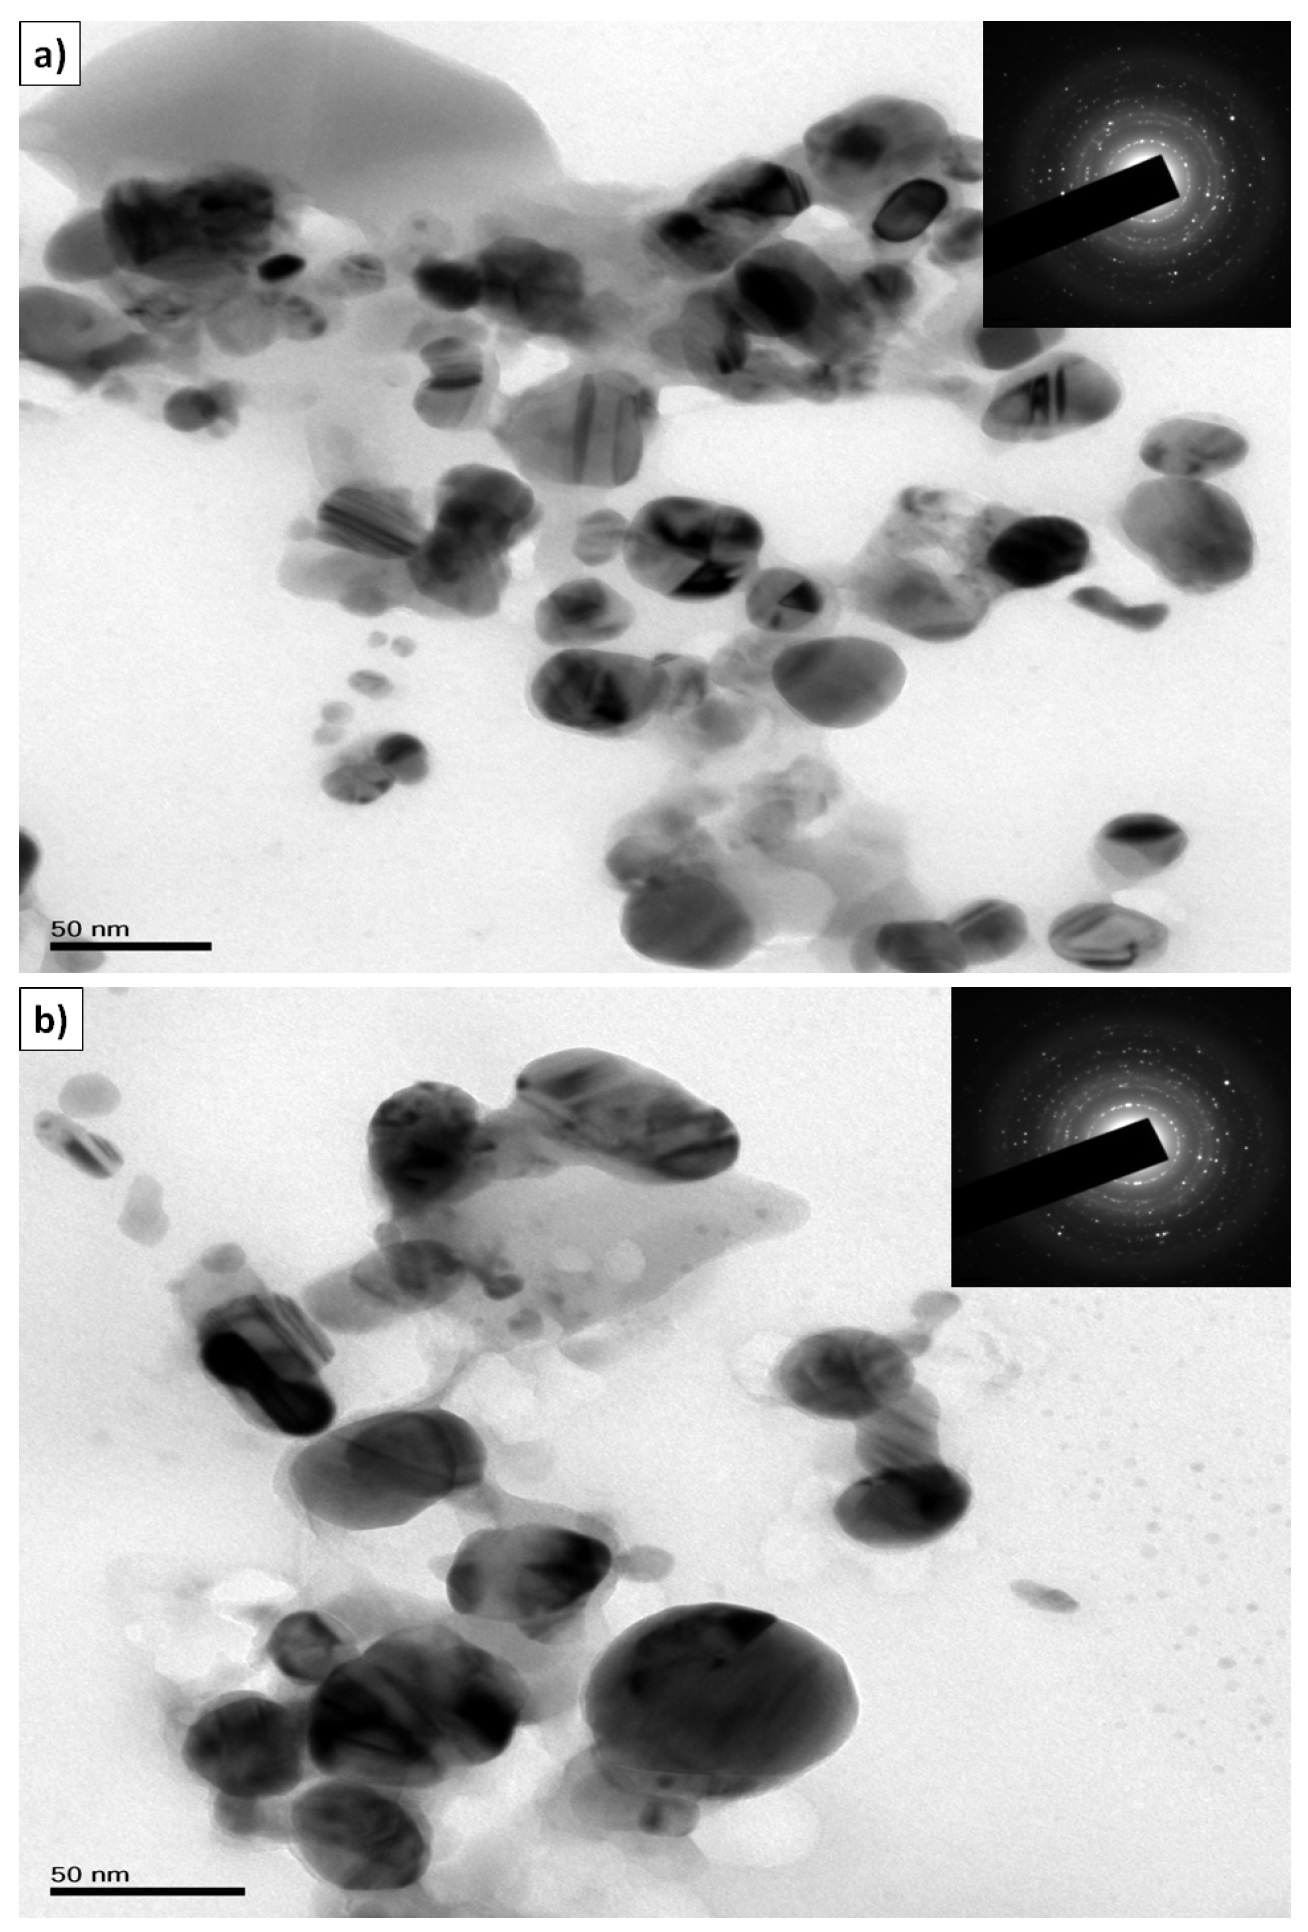
Figure 4. TEM micrograph of silver nanoparticles synthesized from (a) 1.0 X 10⁻³M AgNO3 (S1) and fruit extract (1 mL), (b) TEM image of larger particles synthesized from 3.0 X 10⁻³M (S5) AgNO3 solution and fruit extract (1 mL) (inset shows the SAED pattern of nanocrystalline silver.
The TEM images taken after storing the nanoparticle solutions for 10 days showed very little agglomeration in silver NPs while no agglomeration was found in gold NPs. From this, it could be concluded that kiwi fruit extract might be acting as reducing as well as stabilizing agent. TEM images show that the small particle clusters are coated with a thin organic layer, which acts as a capping agent since the nanoparticles showed a very good distribution inside the bio-reduced aqueous solution, even in microscopic scale. EDAX results confirmed that silver and gold are the major elements. The optical absorption spectrum at 3 keV38 [Fig. S1(a), see SI] indicated the presence of metallic silver and the optical absorption spectrum at 2 keV39 [Fig. S1(b), see SI] indicated the presence of metallic gold. The zeta potential values of S1 and G1 have been indicated as -1.46 and -22.3 mV (Fig. S2, see SI). It is worth to mention that the silver nanoparticles showed lower potential due to little agglomeration of the particles as indicated in TEM images while gold nanoparticles have shown high zeta potential value because of uniform distribution of particles.
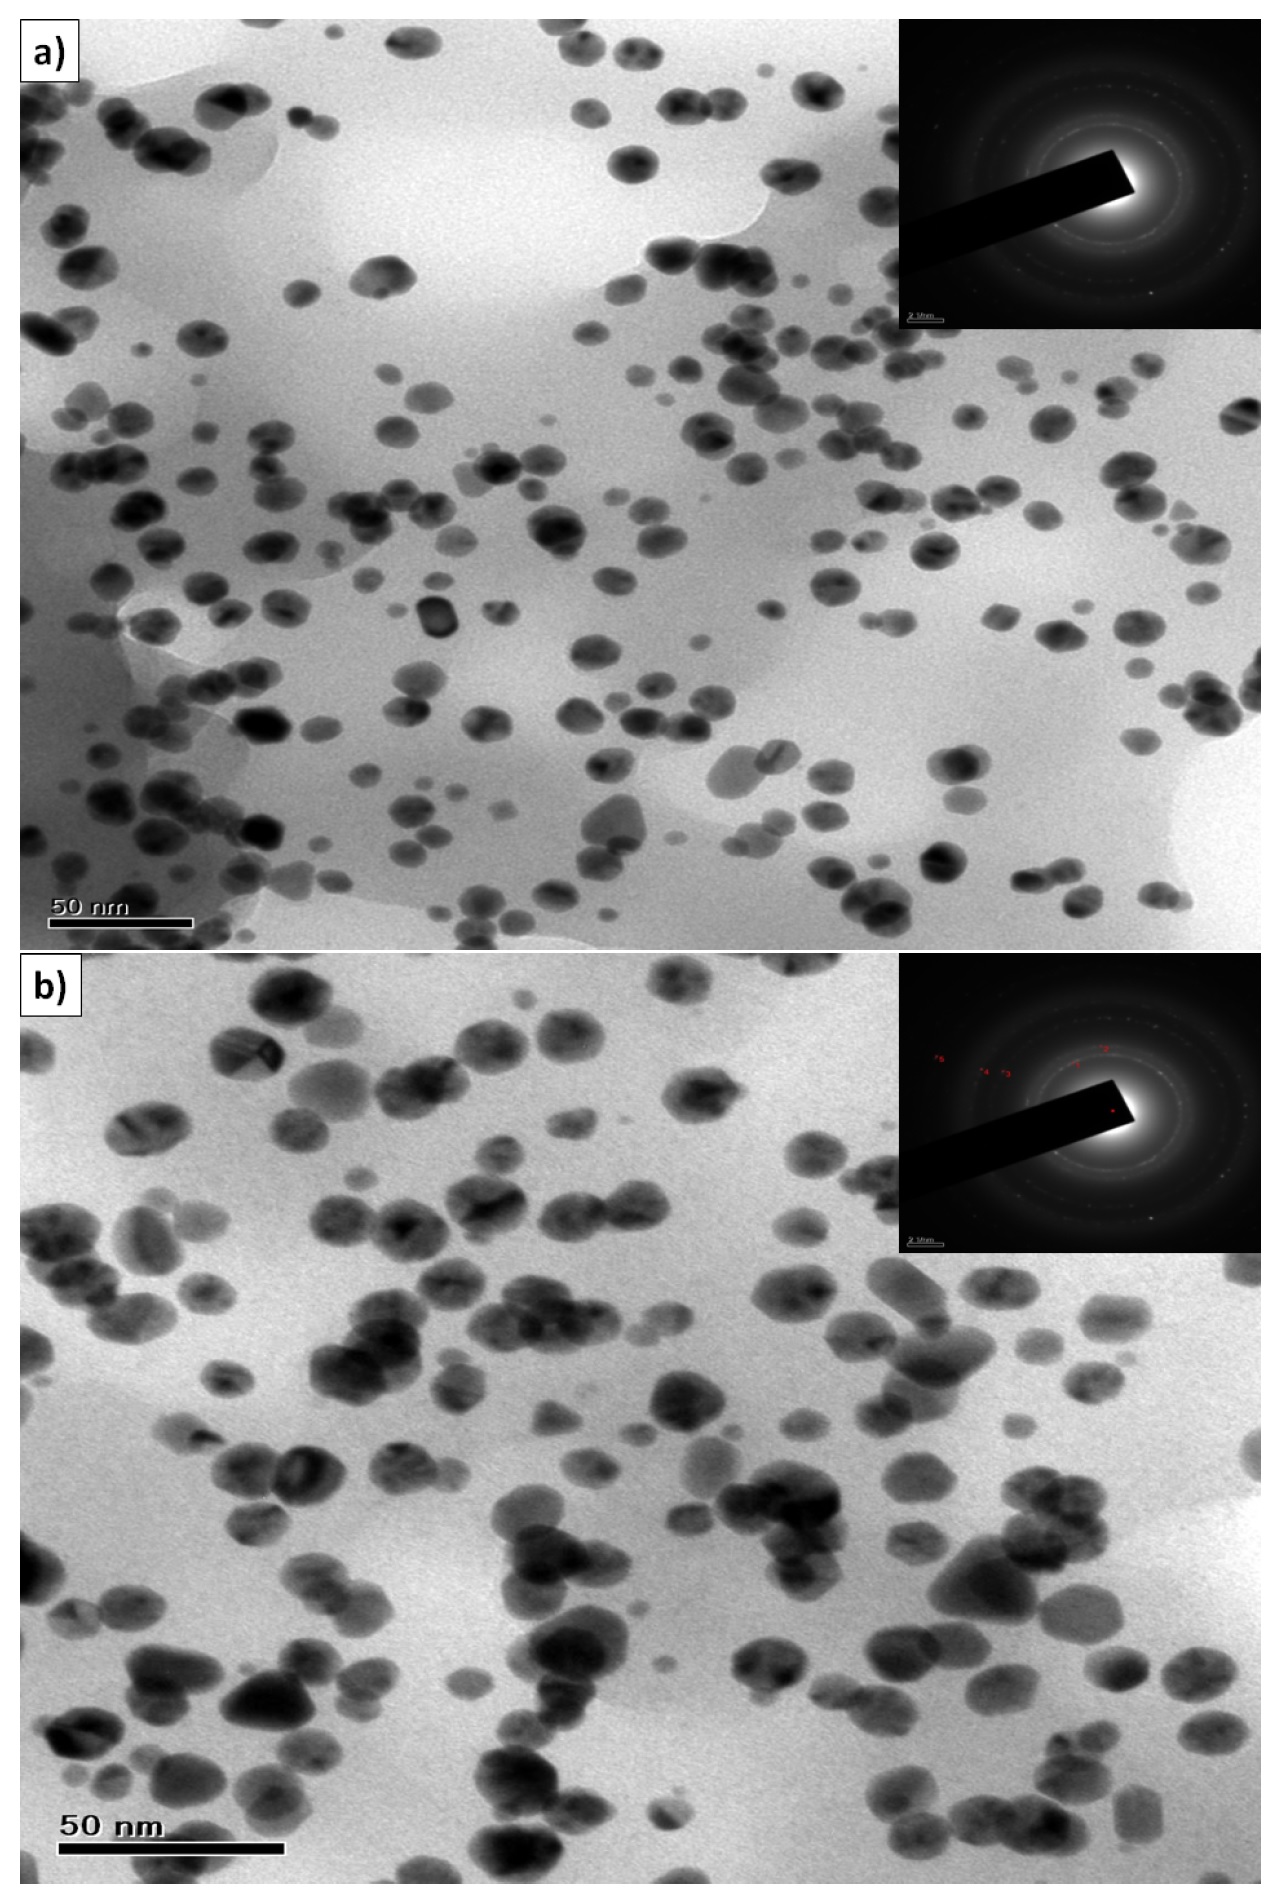
Figure 5. TEM micrograph of gold nanoparticles synthesized from (a) 1.0 X 10⁻³M (G1) HAuCl4 and fruit extract (1 mL), (b) TEM image of larger particles synthesized from 3.0 X 10⁻³M (G5) HAuCl4 solution and fruit extract (1 mL) (inset shows the SAED pattern of nanocrystalline gold).
FT-IR Analysis
The FT-IR spectra were analyzed for identification of possible functional groups which help in formation of nanoparticles. The FT-IR spectrum of fruit extract (Fig. S3, see SI) showed peaks at 3448 cm‑1 corresponding to free N–H (primary amine), at 1639 cm−1 corresponding to C=C vibration, which support the presence of some proteins. It has been reported that proteins present in the fruit extract might act as capping agents for the biosynthesized nanoparticles.40,41 Gole et al. have also reported that proteins could cap the gold NPs either through free amine groups or cysteine residues in the proteins.42
Antimicrobial Activity of Silver and Gold Nanoparticcles
To evaluate the antibacterial activity, the S1 and G1 particles have been utilized due to their smaller particle size.43 Two clinically isolated pathogens P. aeruginosa and S. aureus from the patient’s blood have been used for the antimicrobial activity study. Silver NPs showed excellent antimicrobial activity for the two replicates as presented in Fig. S4(a) (see SI). The antimicrobial activity of the nanoparticles has been observed to increase with increase in the concentration of nanoparticles (Table S1, see SI),44 which could be attributed to larger quantum of nanoparticles available to kill the microorganisms. The presence of thin peptidoglycon layer in its cell wall of Gram –ve bacterium facilitates easy penetration of silver and gold NPs making them strong antimicrobial agents against P. aeruginosa as seen by the maximum zone of inhibition. The smaller zone of inhibition noticed for Gram +ve bacteria may be because of the strong structure of linear polysaccharide making penetration of nanoparticles difficult.45 The significant bactericidal activity observed may be due to the released silver cations which change the membrane characteristics resulting in increased membrane permeability of the bacteria.46,47 Several reports indicate explicitly that silver ions released from silver NPs get attached to the negatively charged cell wall of the bacteria and rupture it leading to denaturing of the protein and finally their death.48 The attachment of either silver ions or nanoparticles to the cell wall causes accumulation of envelope protein precursors. Interestingly, Lok et al. have brought out that silver NPs exhibited destabilization of the outer membrane and rupture of the plasma membrane thereby causing depletion of intracellular ATP.49 Sarkar et al. have also reported that silver NPs showed greater bactericidal efficiency against S. aureus, compared to penicillin.50 The gold NPs synthesized showed excellent inhibition zone [Fig. S4(b), see SI] against all the test organisms but the activity was observed to be less compared to silver NPs. Furthermore, the nanoparticles synthesized by green route were found to be highly effective against Gram -ve bacteria, though the exact mechanism is not yet known.
Catalytic Degradation of 4-Nitrophenol
The catalytic reduction of 4-NP in the presence of silver NPs (S1 & S5) and gold NPs (G1 & G5) was monitored by UV-Vis spectroscopy. Though the reduction of 4-NP to 4-AP by aqueous NaBH4 is thermodynamically favorable, the presence of the kinetic barrier due to large potential difference between donor and acceptor molecules decreases the feasibility of this reaction.
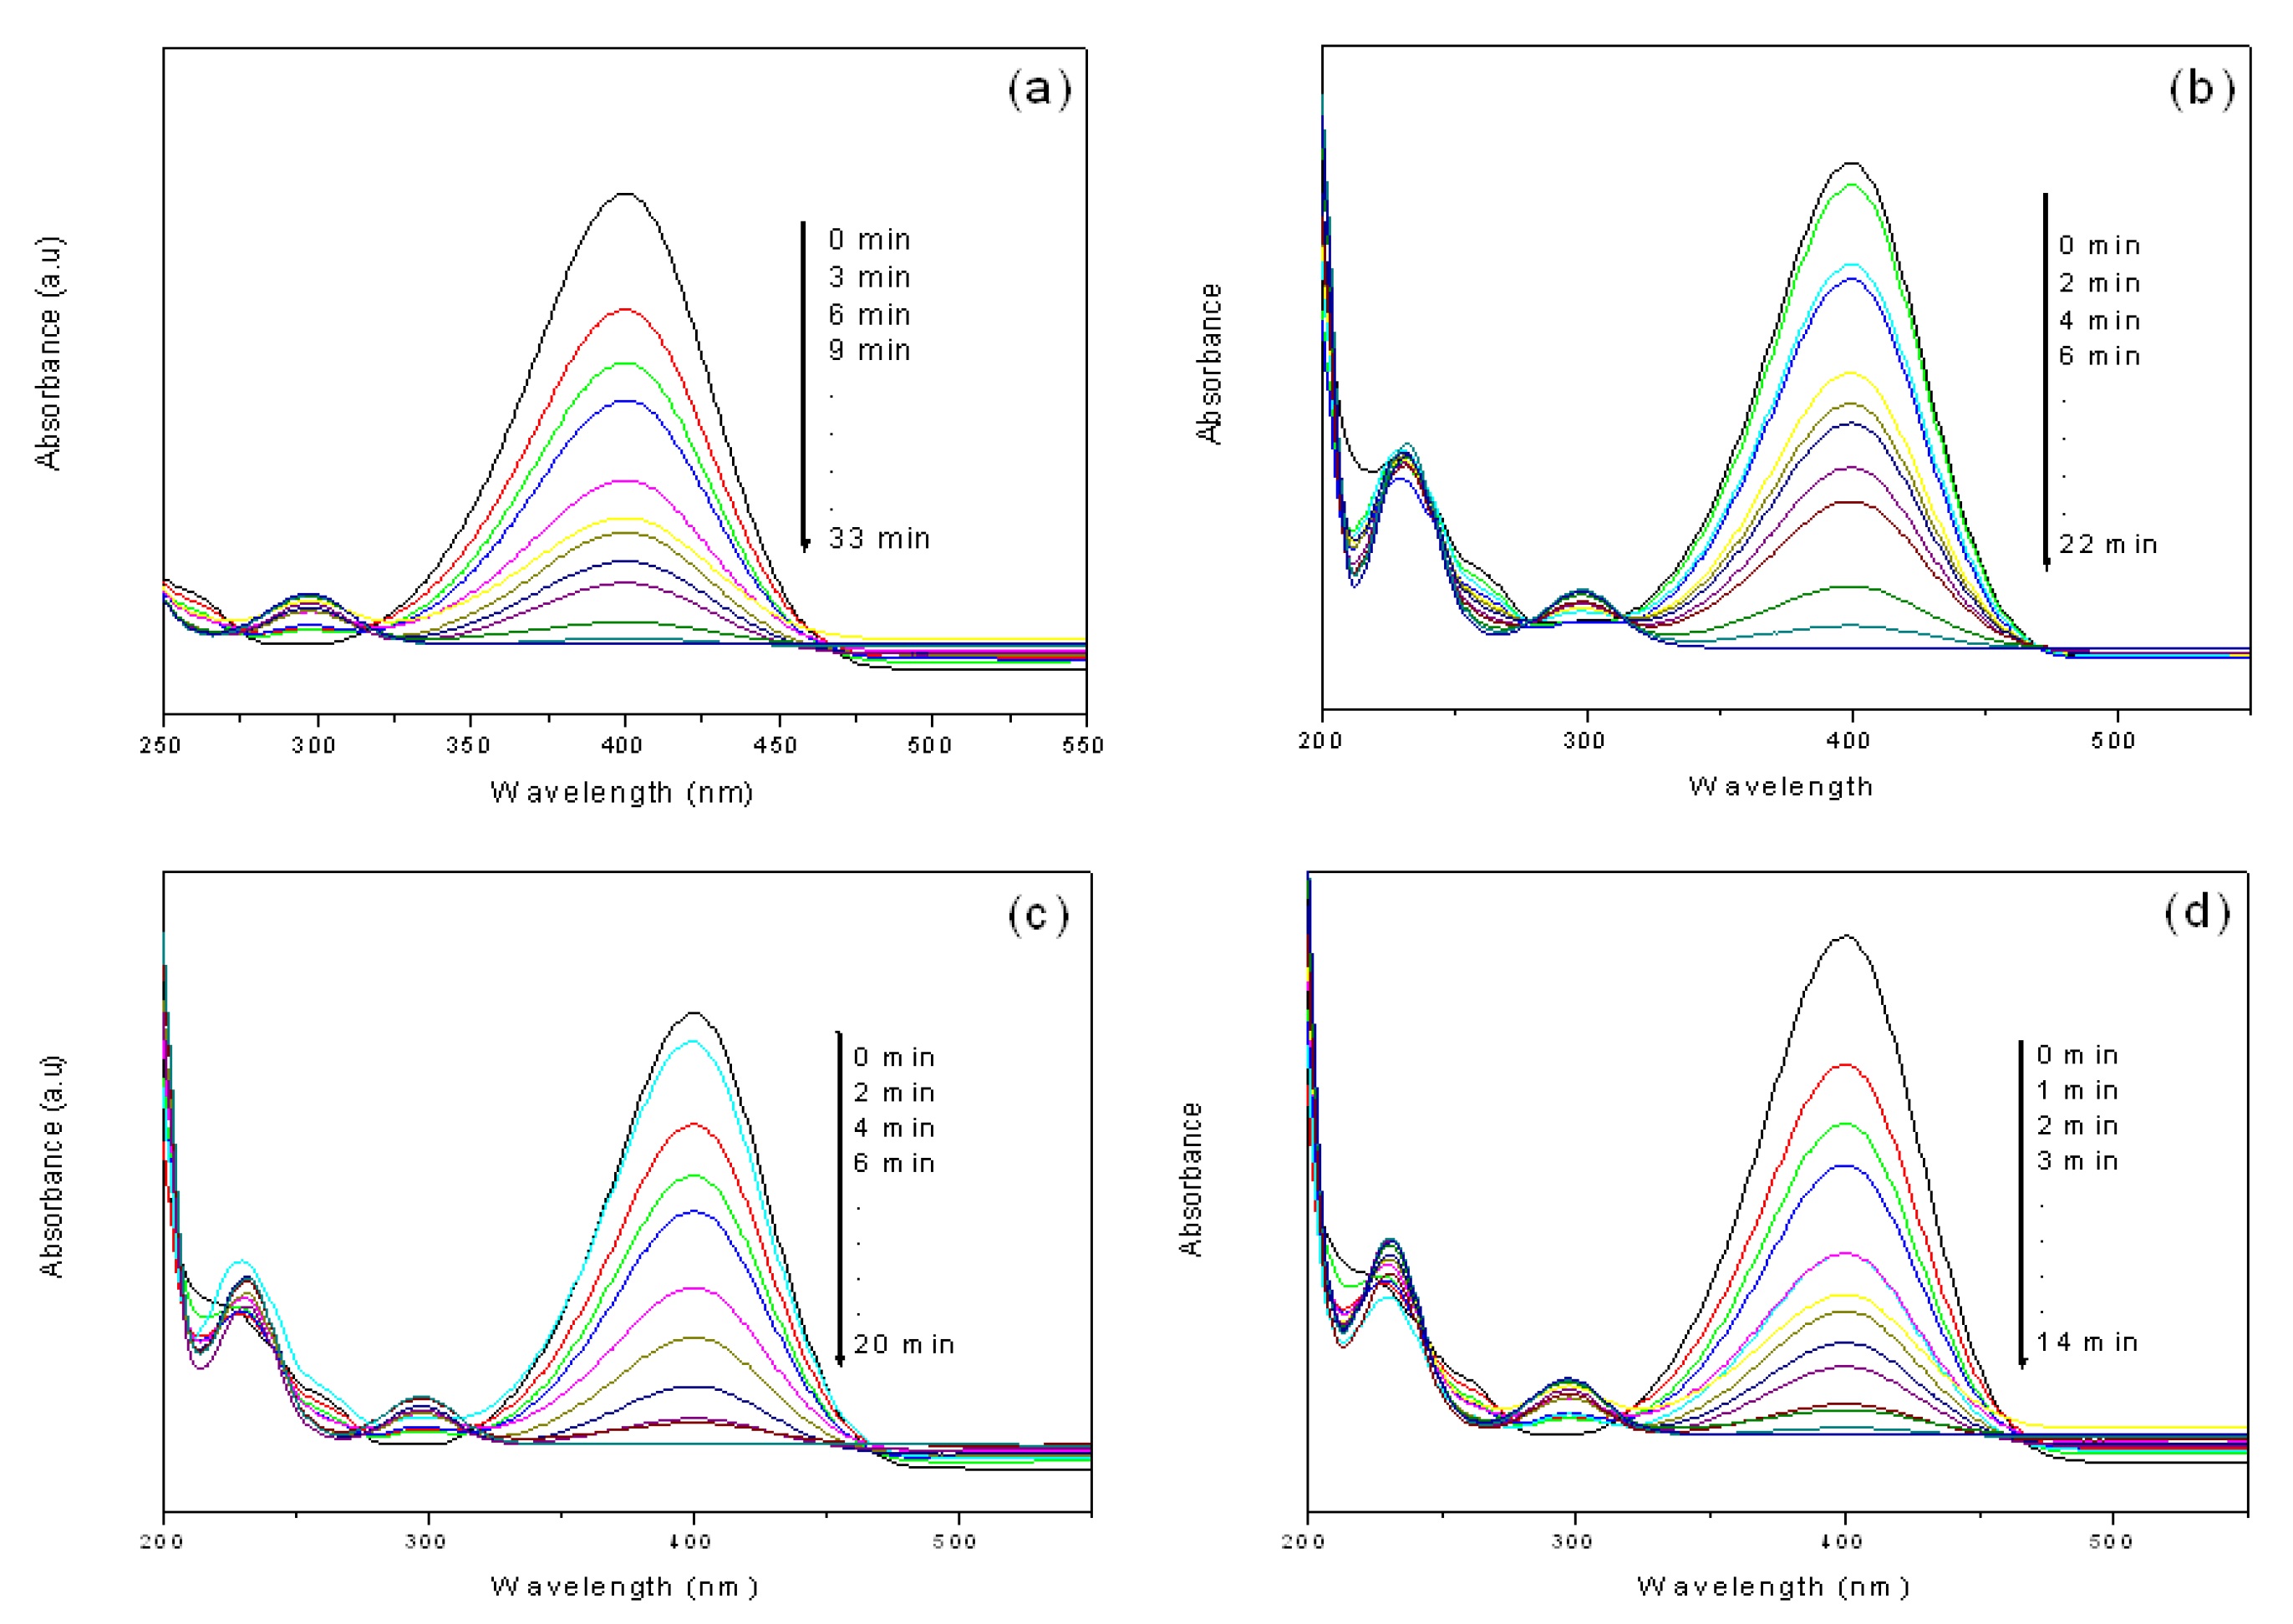
Figure 6. Time-dependent UV-Visible spectra for the catalytic reduction of 4-NP by NaBH4 in the presence of (a) S5 (b) S1 (c) G5 and (d) G1 catalysts obtained from 1 mL of extract.
It is well-known that the metal nanoparticles catalyze this reaction by facilitating electron relay from the donor BH4- to acceptor 4-NP to overcome the kinetic barrier. The 4-NP shows an absorbance peak at around 317 nm, which shows a red shift to 400 nm in the presence of NaBH4 due to the formation of 4-nitrophenolate ion in the alkaline medium caused by NaBH4.51 The data in Fig. 6(a) indicates that the reduction gets completed in 33 min in the presence of S5 nanoparticles, consistent with the disappearance of the yellow colour of 4-NP while the reaction in the presence of S1 nanoparticles [Fig. 6(b)] takes 22 min for completion. Similarly the reduction of 4-NP in the presence of G5 nanoparticles [Fig. 6(c)] gets completed in 20 min while with G1 nanoparticles [Fig. 6(d)] it takes 14 min for completion. The reaction was carried out with water as control in place of nanoparticle solution and the peak at 400 nm remained unaltered even after 5 days, thus confirming the catalytic role of nanoparticles in the reduction process. Plots of ln (A) vs time for the reduction of 4-NP by NaBH4 in the presence of both metal nanoparticles shown in Fig. S5 (a) & (b) (see SI) clearly indicates that after the induction time plot of ln (A) and time t shows a linear relation through 90% completion of the reaction. Decrease in reaction rate was observed with the increase in concentration of metal ion solution. Such decreasing rate of catalytic activity with increase in metal ion concentration can be attributed to an increase in the particle size, as suggested by TEM and DLS measurements. Esumi et al. have reported similar trend in the catalytic activity of dendrimer metal nanocomposites during the reduction of 4-NP with increase in the concentration of dendrimer.52
Catalytic Degradation of Methylene Blue
Kinetics of catalytic reduction of MB has been studied in the presence of NaBH4. Relative absorbance at 664 nm and 614 nm is plotted as a function of time to evaluate the rate of reduction of MB. It has been reported that the main absorption band at 664 nm is corresponding to n-π* transition of MB. During reduction reaction of MB it converts to its reduced form Leuco MB (LMB).53,54 Fig. 7 (a) shows the reduction of MB in the presence of S5 catalyst over a time period of 39 min, the observed decrease in absorbance indicating that the reduction of MB is a slow process. The reduction is found to get accelerated in the presence of S1 catalyst [Fig. 7(b)]
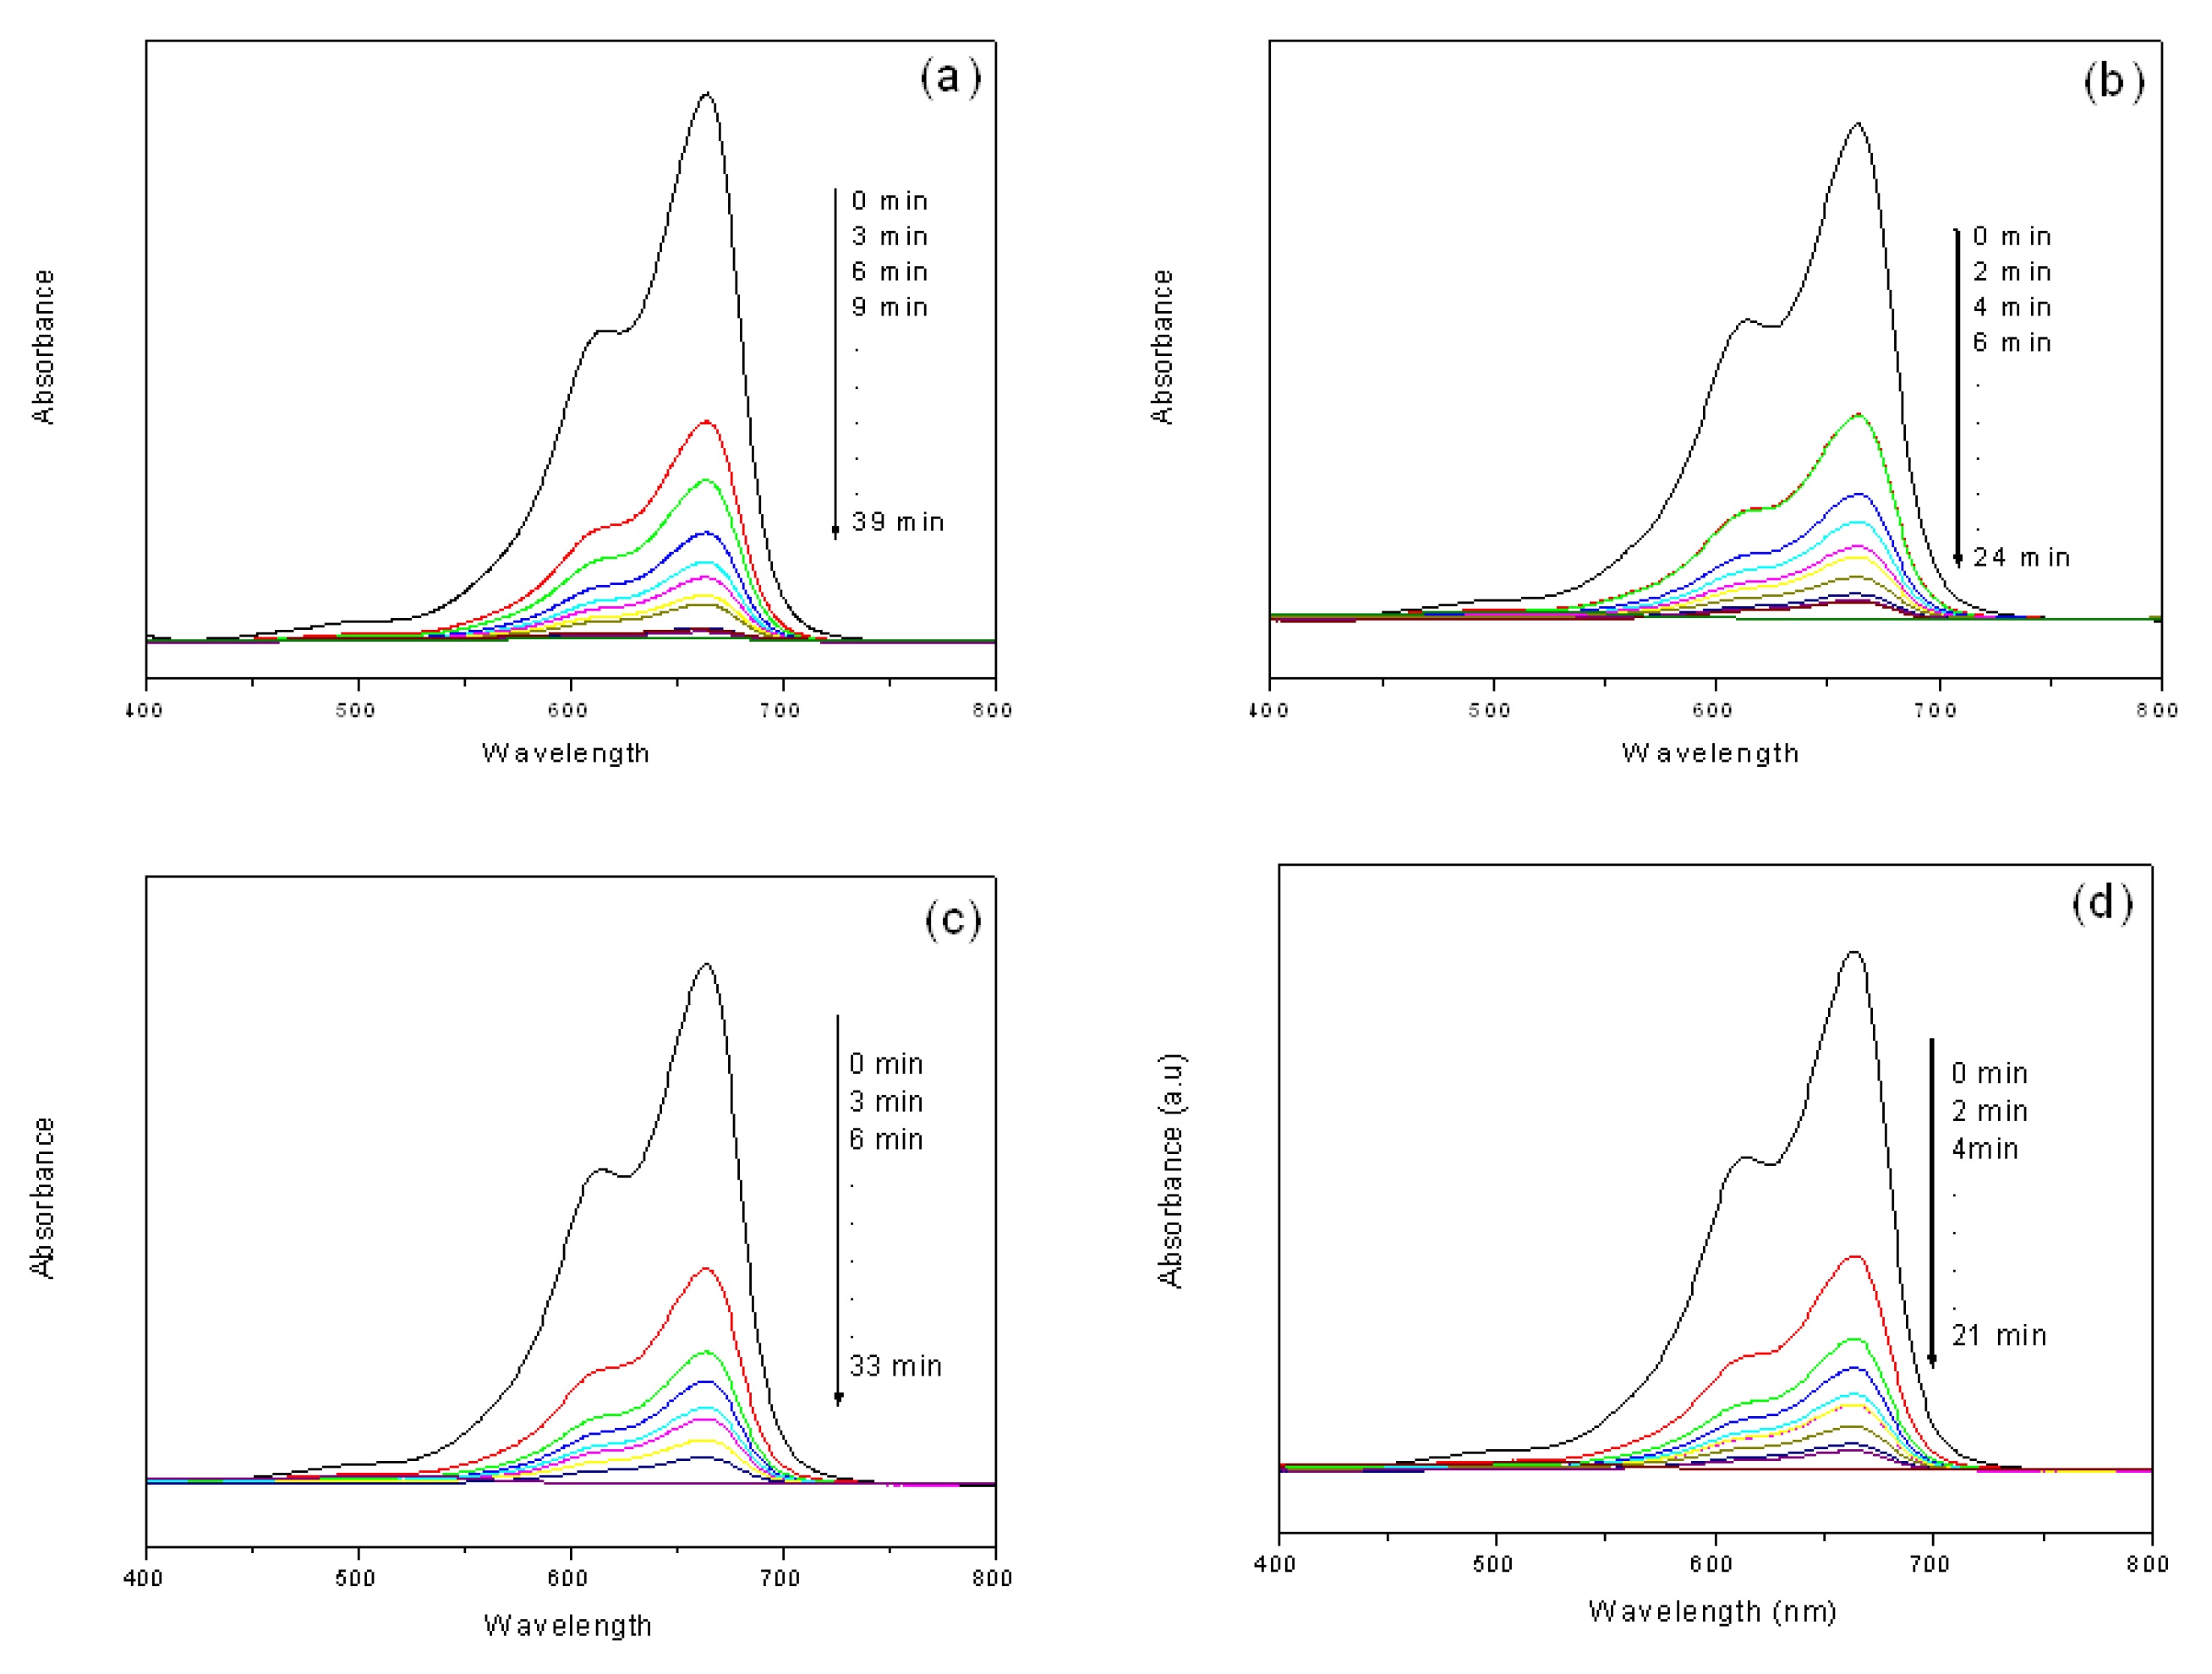
Figure 7. Time-dependent UV-Visible spectra for the catalytic reduction of MB by NaBH4 in the presence of (a) S5 (b) S1 (c) G5 t and (d) G1 catalyst obtained from 1 mL of extract.
and goes to completion in 24 min which is indicated by a strong decrease in the absorbance. Similarly particle size dependence on rate of catalytic reduction of MB to LMB was also investigated in the presence of G5 and G1 catalysts. From Fig. 7(c), it can be seen that the time required for complete reduction of MB is recorded as 33 min in the presence of G5 catalyst, while G1 catalyst [Fig. 7(d)] helped completion of the reduction in 21 min. Figure S5 (c) & (d) (see SI) show Plots of ln (A) vs time for the reduction of MB to LMB in the presence of both metal nanoparticles showing a linear relation between ln (A) and time t till 90% completion of the reaction. The increase in reaction time with the increase in metal ion concentration might be because of increase in size of the particles as explained earlier in 4-NP reduction. For effective catalysis, the redox potential of silver nanoparticles needs to be located between the redox potential of donor (NaBH4) and the acceptor (MB) system.55 Due to electron relay effect, the metal nanoparticles act as electron transfer mediators between MB and NaBH4 during their action as a redox catalyst.
Conclusions
Silver and gold nanoparticles have been successfully synthesized using kiwi fruit extract, an environmentally benign and renewable fruit which acts as reducing as well as stabilizing agent. UV-Vis spectroscopy and TEM micrographs of the synthesized silver and gold hydrosol suggest that with the increase of concentration of aqueous solutions, the particle size increases due to which broadening and shifting of SPR band takes place. The adopted method requires only a few minutes to achieve higher than 90% conversion when the reaction temperature was raised to 80 °C. The synthesized nanoparticles have shown good catalytic activity during the reduction of two organic pollutants 4-NP and MB. With the decrease in size of the nanoparticles, the reaction time is observed to decrease due to their higher surface area. In addition, the synthesized nanoparticles have also exhibited excellent bactericidal activity against clinically isolated P. aeruginosa and S. aureus.
Acknowledgements
The help extended by Dr. Balachandran Unni Nair, Chief Scientist and Head, Chemical Laboratory, Central Leather Research Institute, CSIR Chennai, India for instrumentation is gratefully acknowledged.
Notes and References
* Corresponding Author Details: A. Sivakumar, Chemistry Division, School of Advanced Sciences, VIT University, Vellore-632014, India.
† Supporting Information (SI) available: [Spectral and Bacterial activity data].
1. A. M. Smith, H. Duan, M. N. Rhyner, G. Ruan and S. Nie, Phys. Chem. Ch. Ph., 2006, 33, 3895.
2. J. F. Hernández-Sierra, F. Ruiz, D. Pena, F. Martinez-Gutierrez, A. E. Martinez and G. Ade, Nanomedicine, 2008, 4, 237.
3. A. Dror-Ehre, H. Mamane, T. Belenkova, G. Markovich and A. Adin, J. Colloid Interface Sci., 2009, 339, 521.
4. D. M. Eby, N. M. Schaeublin, K. E. Farrington, S. M. Hussain and G. R. Johnson, ACS Nano, 2009, 3, 984.
5. A. Panacek , M. Kola, R. Vecerova, R. Prucek , J. Soukupova, V. Krys tof, P. Hamal, R. Zboril and L. Kvı tek, Biomaterials, 2009, 30, 6333.
6. A. M. Fayaz, K. Balaji, M. Girilal, R. Yadav, P. T. Kalaichelvan and R. Venketesan, Nanomedicine, 2010, 6, 103.
7. Da-Guang Yu, Colloids Surf. B, 2007, 59, 171.
8. Y. C. Liu and L. H. Lin, Electrochem. Commun., 2004, 6, 1163.
9. K. Mallick, M. J. Witcomb and M. S. Scurrell, Mater. Chem. Phys., 2005, 90, 221.
10. C. H. Bae, S. H. Nam and S. M. Park, Appl. Surf. Sci., 2002, 197, 628.
11. P. T. Anastas and J. C. Warner, Green Chemistry: Theory and Practice, (Oxford University Press: New York), 1998.
12. J. M. De Simone, Science, 2002, 297, 799.
13. R. A. Gross and B. Kalra, Science, 2002, 297, 803.
14. M. Poliakoff and P. Anasta, Nature, 2001, 413, 257.
15. P. Raveendran, J. Fu and S. L. Wallen, J. Am. Chem. Soc., 2003, 125, 13940.
16. W. B. Zhang, X. M Xiao, T. C. An, Z. G. Song, J. M Fu, G. Y. Sheng and M. C. Cui, J. Chem. Technol. Biotechnol., 2003, 78, 788.
17. M. A. Oturan, J. Peiroten, P. Chartrin and A. J. Acher, Environ. Sci. Technol., 2000, 34, 3474.
18. U. G. Akpan and B. H. Hameed, J. Hazard. Mater., 2009, 170, 520.
19. M. S. Díaz-Cruz and D. Barceló, Chemosphere, 2008, 72, 333.
20. J. M. Small and H. Hintelmann, Anal. Bioanal. Chem., 2007, 387, 2881.
21. J. Burhenne, K. D. Riedl, J. Rengelshausen, P. Meissner, O. Muller, G. Mikus, W. E. Haefeli and I. Walter-Sack, J. Chromatogr. B, 2008, 863, 273.
22. N. K. Sahoo, K. Pakshirajan and P. K. Ghosh, J. Hazard. Mater., 2011, 190, 729.
23. P. K. Arora and R. K. Jain, PLoS One, 2012, 7, e38676.
24. K. B. Narayanan, H. H. Park and N. Sakthivel, Spectrochim. Acta. A, 2013, 116, 485.
25. V. K. Vidhu and D. Philip, Spectrochim. Acta. A, 2014, 117, 102.
26. S. S Yudha, D. Notriawan, E. Angasa, T. E. Suharto, J. Hendri and Y. Nishina, Mater. Lett., 2013, 97, 181.
27. T. C. Prathna, N. Chandrasekaran, M. A. Raichur and A. Mukherjee, Colloids Surf. B, 2011, 82, 152.
28. D. Philip, Physica E, 2010, 42, 1417.
29. M. Noruzi, D. Zare, K. Khoshnevisan and D. Davoodi, Spectrochim Acta. A, 2011, 79, 1461.
30. S. Prabha Dubey, M. Lahtinen and M. Sillanpaa, Colloids Surface. A, 2010, 364, 34.
31. V. Ganesh Kumar, S. Dinesh Gokavarapu, A. Rajeswari, T. Stalin Dhas, V. Karthick, Z. Kapadia, T. Shrestha, I. A. Barathy, A. Roy and S. Sinha, Colloids Surf. B, 2011, 87, 159.
32. H. J. Lee, J. Y. Song and B. S. Kim, J. Chem. Technol. Biotechnol., 2013, 88, 1971.
33. A. Tripathi, N. Chandrasekaran, A. M. Raichur and A. Mukherjee, J. Biomed. Nanotechnol., 2009, 5, 93.
34. S. Vivekanandhan, M. Misra and A. K. Mohanty, J. Nanosci. Nanotechnol., 2009, 9, 6828.
35. H. Bar, D. K. Bhui, G. P. Sahoo, P. Sarkar, S. Pyne and A. Misra, Colloids Surf. A, 2009, 348, 212.
36. J. Y. Song and B. S. Kim, Bioprocess. Biosyst. Eng., 2009, 32, 79.
37. A. Rai, A. Singh, A. Ahmad and M. Sastry, Langmuir, 2006, 22, 736.
38. P. Magudapathy, P. Gangopadhyay, B. K. Panigrahi, K. G. M. Nair and S. Dhara, Physica B, 2001, 299, 142.
39. M. M. Alvarez, J. T. Khoury, T. G. Schaaff, M. N. Shafigullin, I. Vezmar and R. L. Whetten, J. Phys. Chem. B, 1997, 101, 3706.
40. S. Li, Y. Shen, A. Xie, X. Yu, L. Qiu, L. Zhang and Q. Zhang, Green. Chem., 2007, 9, 852.
41. S. S. Shankar, A. Ahmad and M. Sastry, Biotechnol Progr, 2003, 19, 1627.
42. A. Gole, C. Dash, R. Vidya, S. R. Sainkar, A. B. Mandale, M. Rao and M. Sastry, Langmuir, 2001, 17, 1674.
43. Z. Lu, K. Rong, J. Li, H. Yang and R. Chen, J. Mater. Sci., 2013, 24, 1465.
44. J. S. Kim, E. Kuk, K. N. Yu, J. H. Kim, S. J. Park, H. J. Lee, S. H. Kim, Y. K. Park, C. Y. Hwang, Y. K. Kim, Y. S. Lee, D. H. Jeong and M. H. Cho, Nanomedicine, 2007, 3, 95.
45. S. Shrivastava, T. Bera, A. Roy, G. Singh, P. Ramachandrarao and D. Dash, Nanotechnology, 2007, 18, 225103.
46. P. Dibrov, J. Dzioba, K. K. Gosink and C. C. Hase, Antimicrob. Agents. Chemother., 2002, 46, 2668.
47. I. Sondi and B. S. Sondi, J. Colloid Interface Sci., 2004, 275, 177.
48. Y. E. Lin, R. D. Vidic, J. E. Stout, C. A. McCartney and V. L Yu, Water. Res., 1998, 32, 1997.
49. C. N. Lok, C. M. Ho, R. Chen, Q. Y. He, W. Y. Yu, H. Sun, P. K. Tam, J. F. Chiu and C. M. Che, J. Proteome. Res., 2006, 5, 916.
50. S. Sarkar, A. D. Jana, S. K. Samanta and G. Mostafa, Polyhedron, 2007, 26, 4419.
51. N. Pradhan, A. Pal and T. Pal, Colloids Surf. A, 2002, 196, 247.
52. K. Esumi, R. Isono and T. Yoshimura, Langmuir, 2004, 20, 237.
53. M. A. Rauf, M. A. Meetani, A. Khaleel and A. Ahmed, Chem. Eng. J., 2010, 157, 373.
54. I. Laoufi, R. Lazzari, J. Jupille, O. Robach, S. Garaud, G. Cabaih, P. Dolle, H. Crugel and A. J. Baillly, J. Phys. Chem. C, 2011, 115, 4673.
55. N. R. Jana, T. K. Sau and T. Pal, J. Phys. Chem. B, 1999, 103, 115.
- Author(s): K. Venkatesan, P. V. V. Mohanaraob and V. S. V. Satyanarayana
- Category: HTML FullText
- Published: 02 February 2017
Telmisartan - Antihypertensive Drug: A Short Review on Synthetic Methods
K. Venkatesana, P. V. V. Mohanaraob and V. S. V. Satyanarayanac,*
aDepartment of Humanities and Sciences, CVR College of Engineering, Hyderabad, Telangana –501510, India.
bR&D Chemistry, Acebright (India) Pharma Pvt. Ltd., KIADB Indl. Area, Jigani, Bangalore – 560105.
cReaxZen Healthcare Pvt. Ltd., Boduppal, Hyderabad – 500039, India.
Published Online 09 01 2017
Telmisartan is a potent antagonist of the angiotensin II type-1 (AT1) receptor that is used for the treatment of essential hypertension. It selectively inhibits stimulation of the AT1 receptor without affecting other receptor systems involved in cardiovascular system. This review describes the different synthetic routes followed for the total synthesis of Telmisartan which will be useful for the researchers to find several literature reported synthetic methods in one place who intended to develop a new eco-friendly and cost-effective method in industrial scale.
INTRODUCTION
Telmisartan (I) is a potent angiotensin II receptor blocker (ARB) antagonist used in the treatment of essential hypertension and also used to reduce the risk of heart attack, stroke.1-7 It was discovered by Boehringer Ingelheim.8 It has high bioavailability, long half life, good security, few side effects, so it can be used as a first-line drug in the treatment of hypertension. Telmisartan is currently available in the market as an antihypertensive drug under the trade name of MICARDIS.9 Telmisartan is an important member of this class of top-selling drugs because it has the strongest binding affinity to the AT1 receptor, excellent bioavailability, and a once-per-day dosage.10,11
Telmisartan is an angiotensin II receptor blocker shows high affinity for the angiotensin II receptor type 1 (AT1).12 In addition to blocking the rennin-angiotensin system (RAS), which is the central regulator of blood pressure and electrolyte homeostasis.13 In the early 1990s, Merck introduced the nonpeptidic orally active angiotensin II receptor antagonist losartan (Lozaar) as the first member of a new class of antihypertensive drugs called sartans, which contain a characteristic ortho functionalized biaryl moiety.14,15 Telmisartan exhibits favorable effects on renal function in laboratory animals and is not associated with significant ancillary pharmacological effects and limited clinical suggest the potential superiority of telmisartan over losartan 50 mg once daily.16-19 Telmisartan acts as a selective modulator of peroxisome proliferator activated receptor gamma (PPAR-γ), a central regulator of insulin and glucose metabolism. It is believed that telmisartan dual mode of action may provide protective benefits against the vascular and renal damage caused by diabetes and cardiovascular disease (CVD).20-22

Figure 1. Chemical structure of Telmisartan.
Literature showed that telmisartan tablet reduces the tissue weight of WAT (white adipose tissue) and the liver but does not affect other organs, such as the heart or kidneys.23 This review presents relevant information on the total synthesis of Telmisartan by taking different precursors and using distinct synthetic methodologies.
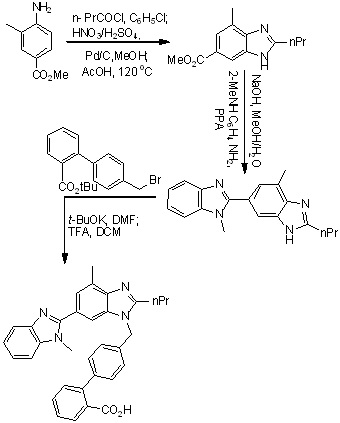
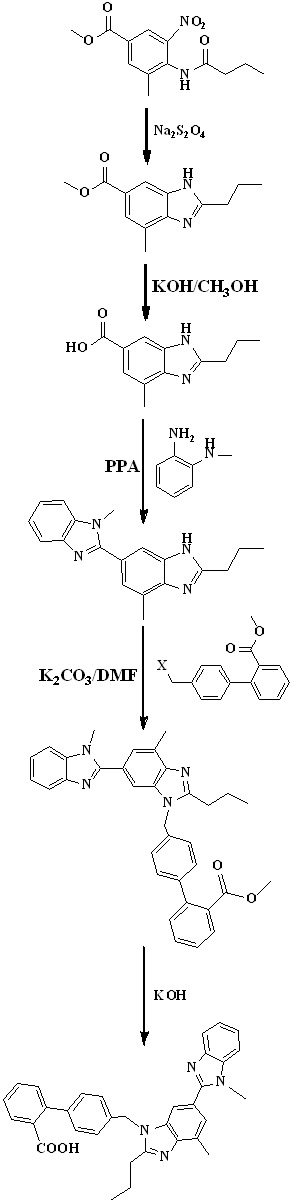
Scheme 1. First reported synthesis of Telmisartan.
SYNTHETIC METHODS
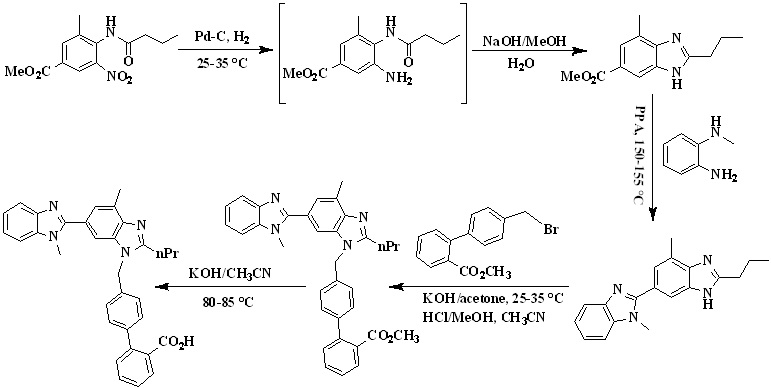
The first total synthesis of telmisartan was reported by Ries et. al., in 1993 (Scheme 1),24 4-amino-3-methylbenzoic acid methyl ester used as an starting material which on undergo acylation with butyryl chloride, followed by nitration using nitrating mixture, reduction of the nitro group using Pd/C and then cyclization of the resulting amine to the benzimidazole derivative using acetic acid. After saponification free carboxyl group present in benzimidazole derivative condensed with N-methyl-1,2-phenylenediamine to form bisbenzimidazole, which is finally alkylated with the 4-(bromomethyl)-2-biphenylcarboxylic acid tert-butyl ester and then hydrolysis to get telmisartan.
In 2007, Srirami Reddy et. al.,25 reported the total synthesis of telmisartan (Scheme 2) from 4-butyrylamino-3-methyl-5-nitro-benzoic acid methyl ester as a starting material due to its commercial availability. First the nitro group was reduced to obtain amine using Pd-C catalyst and the filtrate was concentrated which was directly treated with aqueous sodium hydroxide to furnish benzimidazole intermediate. The intermediate was then condensed with N-methyl-benzene-1,2-diamine in polyphosphoric acid at 150-155 °C to obtain the dibenzimidazole intermediate. The telmisartan was obtained by the alkylation of 4’-Bromomethylbiphenyl-2-carboxylic acid methyl ester with 1,4,-Dimethyl-2’-propyl-1H,3’H-2,5’-dibenzimidazole in acetone in the presence of KOH and the product precipitated was further converted to a hydrochloride salt in methanol. In the next step, hydrochloride salt was hydrolyzed via saponification process using potassium hydroxide as a base in acetonitrile to get the final product - Telmisartan.
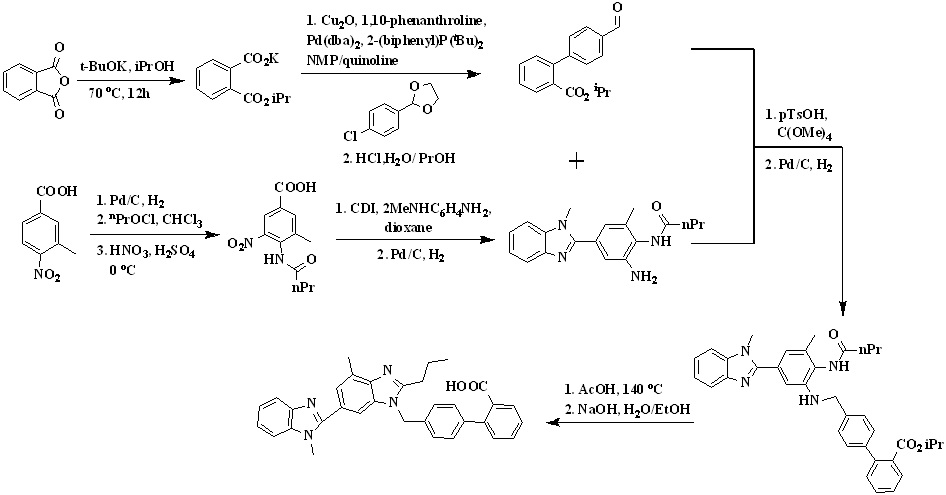
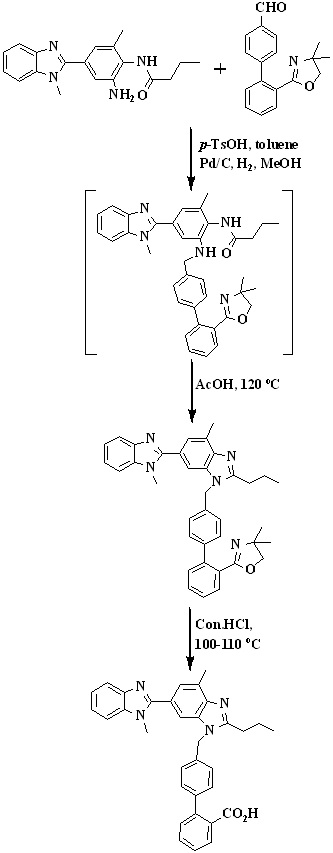
In 2008, Lukas et al.,26 reported a new synthetic way for the synthesis of telmisartan by using phthalic anhydride and 3-methyl-4-nitrobenzoic acid represented in Scheme 3. 3-methyl-4-nitrobenzoic acid undergoes reduction in presence of palladium on charcoal followed by acylation of the amino group with butyryl chloride and then nitration to form 4-butyramido-3-methyl-5-nitrobenzoic acid. The condensation of the carboxyl group of resulted nitrobenzoic acid derivative with n-methyl-1,2-phenylenediamine to form the intermediate N-(2-amino-6-methyl-4-(1-methyl-1H-benzo[d] imidazol-2-yl)phenyl)butyramide.
Scheme 2. Synthetic protocol of Telmisartan reported by Srirami Reddy et al.
Scheme 3. Synthetic protocol of Telmisartan reported by Lukas et al.
The reductive amination of the biaryl aldehyde reacting with the resulted intermediate was carried out in the presence of p-toluenesulfonic acid/tetramethyl-o-carbonate in toluene, followed by a solvent exchange to isopropyl alcohol and hydrogenation to form compound isopropyl 4'-(((2-butyramido-3-methyl-5-(1-methyl-1H-benzo[d] imidazol-2-yl)phenyl)amino)methyl)-[1,1'-biphenyl]-2-carboxylate. The amine isopropyl 4'-(((2-butyramido-3-methyl-5-(1-methyl-1H-benzo[d] imidazol-2-yl)phenyl)amino)methyl)-[1,1'-biphenyl]-2-carboxylate was cyclized into the n-propylbenzimidazole in refluxing glacial acetic acid to form telmisartan isopropyl ester was saponified with sodium hydroxide in methanol and water, and subsequent acidification led to the precipitation of telmisartan.
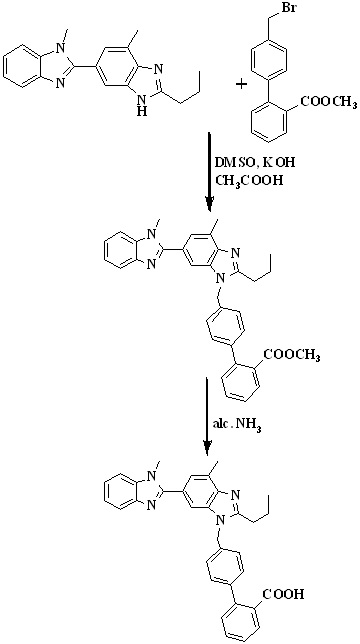
In 2008, Kankan et al.,27 reported an improved process for the preparation of telmisartan (Scheme 4) by the condensation of [lH-Benzimidazole-2-n-propyl-4-methyl-6-(1'-methyl benzimidazole-2'-yl)] and methyl-4(bromomethyl)biphenyl-2-carboxylate in presence of KOH and dimethyl sulphoxide followed by hydrolysis to get the final product.
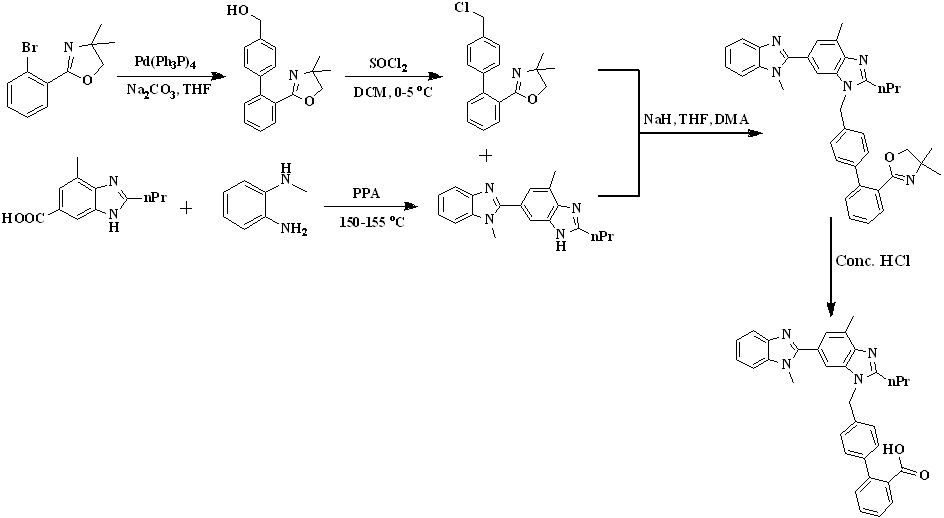
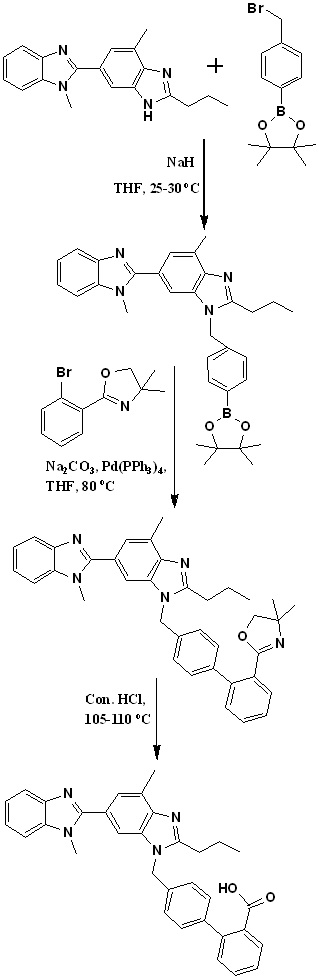
In 2009, Sanjeev Kumar et al.,28,29 developed an efficient two-stage process employing Suzuki coupling to afford telmisartan represented in Scheme 5. Condensation of 2-(4'-chloromethyl-biphenyl-2-yl)-4,4-dimethyl-4,5-dihydrooxazole with dibenzimidazole derivative to form the key intermediate 3'-[2'-(4,4-Dimethyl-4,5-dihydro-oxazol-2-yl)-biphenyl-4-ylmethyl]-1,7'-dimethyl-2'-propyl-1h,3'h-[2,5'] bibenzoimidazolyl, which is on acid hydrolysis to provide telmisartan in good yield. Chlorination of [2’-(4,4-dimethyl-4,5-dihydro-oxazol-2-yl)-biphenyl-4-yl]-methanol with thionyl chloride at low temperature afforded the key intermediate 2-(4'-chloromethyl-biphenyl-2-yl)-4,4- dimethyl-4,5-dihydrooxazole.
Scheme 4. Synthetic protocol of Telmisartan reported by Kankan et al.
Scheme 5. Synthetic protocol of Telmisartan reported by Sanjeev Kumar et al.
In 2010, Sanjeev Kumar et al., also developed an efficient two-stage process employing Suzuki coupling for the preparation of 2-(4'-chloromethyl-biphenyl-2-yl)-4,4-dimethyl-4,5-dihydrooxazole and later condensation with dibenzimidazole derivative. Finally, acid hydrolysis of intermediate 11 provided telmisartan in good yield (Scheme 6).30 Authors identified 4-(hydroxymethyl) phenylboronic acid and 2-(2-bromophenyl)-4,4-dimethyl-2-oxazoline as key starting materials for the preparation of key intermediate 2-(4'-chloromethyl-biphenyl-2-yl)-4,4-dimethyl-4,5-dihydrooxazole (Scheme 6). Suzuki coupling was employed for the preparation of the key intermediate by the reaction of 2-(2-bromophenyl)-4,4-dimethyl-2-oxazoline with 4-(hydroxymethyl) phenylboronic acid in the presence of aqueous sodium carbonate and tetrakistriphenyl phospine palladium (0), which produced [20-(4,4-dimethyl-4,5-dihydro-oxazol-2-yl)-biphenyl-4-yl]-methanol in more than 95% yield; with further chlorination using thionyl chloride at low temperature afforded the key intermediate 2-(40-chloromethyl-biphenyl-2-yl)-4,4-dimethyl-4,5-dihydrooxazole in more than 99% yield.
In 2010, Mehta et al.,31 reported an improved synthetic route for the synthesis of telmisartan via Suzuki coupling presented in Scheme 7. The key intermediate, 2’-(4,4-dimethyl-4,5-dihydro-1,3-oxazol-2-yl)biphenyl-4-carbaldehyde was prepared by reacting 2-(2-bromophenyl)-4,4-dimethyl-2-oxazoline with 4-formyl phenylboronic acid in presence of aqueous sodium carbonate and tetrakistriphenylphospine palladium (0).
The intermediate on reduction with sodium borohydride to form [2’-(4,4-dimethyl- 4,5-dihydro-1,3-oxazol-2-yl)biphenyl-4-yl]methanol. The chlorination with thionyl chloride at low temperature afforded the
Scheme 6. Synthetic protocol of Telmisartan reported by Sanjeev Kumar et al.
key intermediate 2-[4'-(chloromethyl)biphenyl-2-yl]-4,4-dimethyl-4,5-dihydro-1,3-oxazole. 1,4'-dimethyl-2'-propyl-1H,3'H-2,5-dibenzimidazole react with key intermediate in presence of sodium hydride and hydrolysis to form telmisartan.
Scheme 7. Synthetic protocol of Telmisartan reported by Mehta et al.
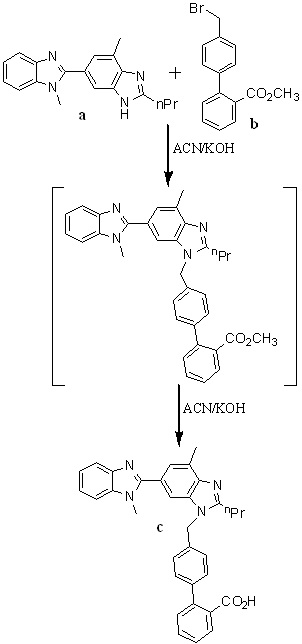
In 2010, Nageswar Rao et al.,32 developed a facile, cost-effective, and improved one-pot synthesis for telmisartan described in Scheme 8. They have chosen 1,4'-dimethyl-2'-propyl-1H,3'H-2,5'-dibenzimidazole as a starting material for the preparation of 4’-(1,4’-dimethyl-2’-propyl-1H-[2,5’]bibenzimidazolyl-3’-ylmethyl)biphenyl-2-carboxylic acid methyl ester, because of its commercial availability. Condensation of compound a with compound b in acetonitrile using potassium hydroxide as a base to afford c, which is an in situ, and then converted into telmisartan by adding potassium hydroxide lot wise instead of dumping to avoid impurity formation.
Scheme 8. Synthetic protocol of Telmisartan reported by Nageswar Rao et al.
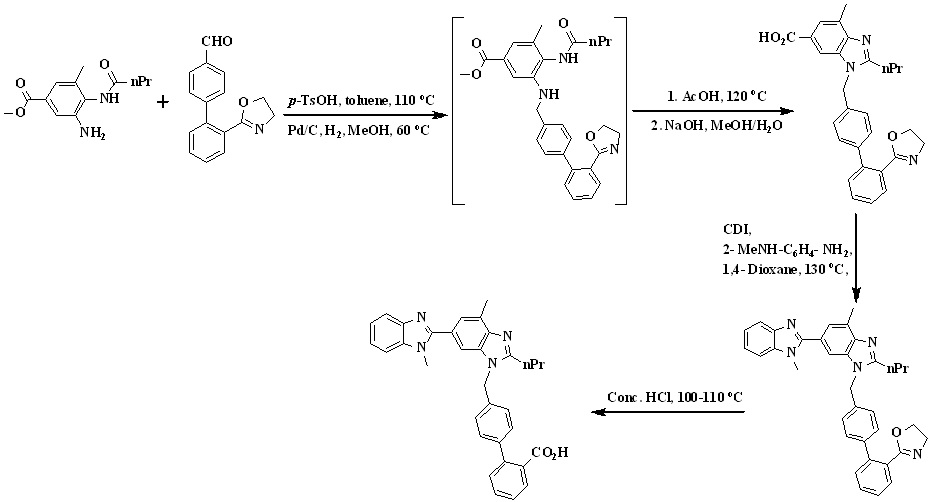
In 2011, Srinivas et al.,33 reported the synthesis of telmisartan by using 4-formylphenylboronic acid and 2-(2-bromophenyl)-4,4-dimethyl-2-oxazoline used as the starting material detailed in Scheme 9. Thus, Suzuki coupling of 2-(2-bromophenyl)-4,4-dimethyl-2-oxazoline with 4-formyl phenyl boronic acid in presence of aqueous sodium carbonate and
Scheme 9. Synthetic protocol of Telmisartan reported by Srinivas et al.

Scheme 10. Synthetic protocol of Telmisartan reported by Ping Wang et al.
tetrakis(triphenylphosphine)palladium(0) in THF gave 2-(4,4-dimethyl-4,5-dihydro-1,3-oxazol-2-yl)biphenyl-4-carbaldehyde. The reaction of biaryl aldehyde with amine was carried out in the presence of p-toluenesulfonic acid in toluene to form the corresponding imine, which on hydrogenation in methanol yielded the amine.
The amine was cyclized in situ to the n-propyl benzimidazole in refluxing glacial acetic acid followed by in situ hydrolysis to the acid to form1-((2'- (4, 4- dimethyl -4, 5-dihydro oxazol -2- yl) biphenyl -4- yl) methyl) -4- methyl-2-propyl-1Hbenzo[d]-imidazole-6-carboxylicacid which is reacting with 1,1’-carbonyldiimidazole (CDI) followed by coupling with N-methyl-1,2-phenylenediamine and in situ cyclization in 1,4-dioxane, afforded the bisbenzimidazole derivative. Finally oxazoline intermediate was treated with concentrated hydrochloric acid to afford telmisartan.
In 2012, Ping Wang et al.,34 reported the total synthesis of telmisartan detailed in Scheme 10. The starting material, o-cresol was treated with chloroform in 10% sodium hydroxide solution to get aldehyde and then nitration via reacting with fuming nitric acid. The phenolic hydroxyl group of compound was protected with dimethyl sulfate followed by reaction with o-phenylenediamine in presence hyderogen peroxide to get compound. The bis-benzimidazole was prepared from benzimidazole substituted o-nitroaniline using butyl aldehyde in the presence of sodium dithionite in the mixture of methanol and water at reflux condition. After this N-alkylation of bis-benzimidazole was done by treated with methyl 4'-(bromomethyl)-2-biphenylcarboxylate in presence of sodium hydride and then saponified with 10% aqueous sodium hydroxide solution in methanol to get telmisartan.
In 2012, Chakrapani et al.,35 reported the low cost synthesis of telmisartan (Scheme 11) by using methyl-4-(butyramido)-3-methyl-5-nitrobenzoate is an starting material undergo reduction using sodium dithionate and cyclisation followed by hydrolysis to form 2-n-propyl-4-mmethyl-6-carboxy benzimidazole. N-methy-o-phenylenediamine on reaction with carboxy benzimidazole derivative in presence of PPA to form bis benzimidazole intermediate. Reaction of 4’-halomethylbipheny-2-carboxylic ester and intermediate in basic condition, followed by hydrolysis to form telmisartan.
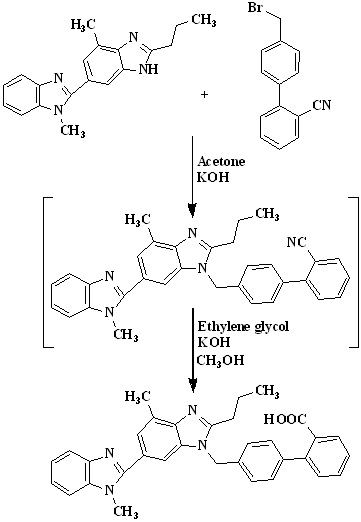
In 2013, Premchand et al.,36 were developed cost-effective and improved one-pot synthesis for telmisartan which is detailed given in Scheme 12. The preparation of 4'-((1,4'- dimethyl-2'-propyl(2,6'-bi-1h-benzimidazole)-1'-yl)methyl)-1,1'-biphenyl-2-carbonitrile was done by using 4’-(bromomethyl) biphenyl-2-carbonitrile used as an raw material because it is very cheap and commercially available in the market. Condensation of 2-n-propyl-4-methyl-6-(1-methylbenzimidazol-2′-yl) benzimidazole 2 with 4'-(bromomethyl) biphenyl-2-carbonitrile in acetone using potassium hydroxide to get 4'-((1,4'-dimethyl-2'-propyl(2,6'-bi-1hbenzimidazole)-1'-yl)methyl)-1,1'-biphenyl-2- carbonitrile followed by hydrolysis using potassium hydroxide in ethylene glycol to get telmisartan.
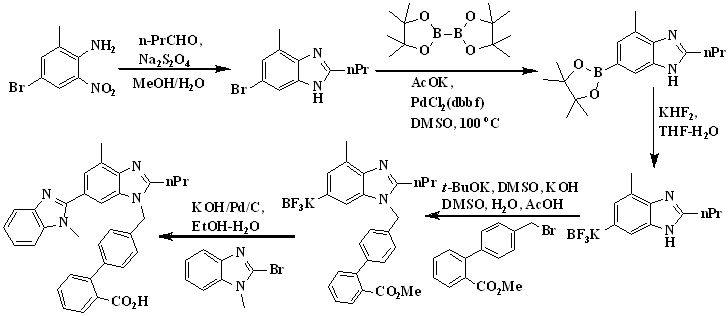
In 2015, Alex et al.,37,38 reported the total synthesis of telmisartan via Suzuki Cross-Coupling reaction between two functionalized benzimidazoles represented in Scheme 13.
Scheme 11. Synthetic protocol of Telmisartan reported by Chakrapani et al.
Scheme 12. Synthetic protocol of Telmisartan reported by Premchand et al.
Benzimidazole was first converted in to trifluoroborate salt in two steps. The reaction of 6-bromo-4-methyl-2-propylbenzimidazole and diboron at 100 °C for 5 h in the presence of PdCl2dppf led to the formation of the desired boronic acid pinacol ester and then converted this pinacol boronate directly to the corresponding trifluoroborate salt, as more reactive toward Suzuki cross-coupling reactions. Suzuki cross-coupling of potassium (1-(2'-Carboxy-[1,1'-biphenyl]-4-yl)-4-methyl-2-propyl-benzimidazole-6-yl)trifluoro borate with 2-bromo-1-methylbenzimidazole was carried out under reaction conditions using PdCl2dppf with KOH in a H2O/EtOH solvent system to afford afforded telmisartan.
The spectral characterization data of Telmisartan reported by different authors is given in Table 1.
Properties of Telmisartan:39-41
|
Chemical Formula : |
C33H30N4O2 |
|
Molecular Weight : |
514.6169 g/mol |
|
Melting Point : |
261-263 °C |
|
Water Solubility : |
Insoluble |
|
DMSO Solubility : |
>5 mg/mL at 60 °C |
|
LogP : |
7.7 |
|
Density : |
1.16 |
|
Colour : |
White to slightly yellowish solid |
|
Formal Charge : |
0 |
|
Hydrogen Bond Donar Count : |
1 |
|
Hydrogen Bond Acceptor Count : |
4 |
Scheme 13. Synthetic protocol of Telmisartan reported by Alex et al.
Table 1: Characterization data of Telmisartan (I).
|
Author |
m.p. (oC) |
1H NMR |
13C NMR |
Mass (m/z) |
|
Ping Wang34 |
261–262 |
1H NMR (DMSO-d6, 400 MHz, ppm) δ 1.15 (t, J 7.2 Hz, 3H, CH3), 1.94-2.03 (m, 2H, CH2), 2.69 (s, 3H, ArCH3), 3.12 (t, J 8 Hz, 2H, CH2), 3.37 (s, 3H, CH3), 5.40 (s, 2H, CH2N), 6.97 (s, 1H, ArH), 7.05 (s, 1H, ArH), 7.16-7.18 (m, 2H, ArH), 7.33-7.50 (m, 8H, ArH), 8.01-8.03 (m, 1H, ArH), 8.37-8.38 (m, 1H, ArH); |
13C NMR (DMSO-d6, 100MHz, ppm) δ 14.1, 17.0, 22.4, 30.0, 31.8, 48.8, 109.4, 111.3, 119.8, 121.8, 123.1, 123.2, 123.6, 127.1, 127.4, 128.8, 128.9, 129.4, 130.2, 130.4, 133.7, 134.0, 134.6, 135.6, 141.1, 141.8, 142.8, 143.6, 154.0, 156.5, 171.1 |
515.2452 |
|
A. Sanjeev Kumar28-31 |
260–262 |
1H NMR (CDCl3, 400 MHz, ppm) δ 12.8 (1H, s, COOH), 8.42 (1H, d, J 8.0 Hz, ArH), 8.02 (1H, d, J 8.0 Hz, ArH), 7.52-7.28 (8H, m, ArH), 7.20 (2H, d, J 8.0 Hz, ArH), 7.05 (1H, s, ArH), 6.96 (1H, s, ArH), 5.42 (2H, s, - CH2), 3.82 (3H, s, CH3), 2.97 (2H, t, J 7.6 Hz, CH2), 2.74 (3H, s, CH3), 1.92 (2H, m, J 7.6 Hz, CH2), 1.04 (3H, t, J 7.6 Hz, CH3); |
13C NMR (DMSO-d6, 400 MHz, ppm) δ 13.5, 16.7, 20.6, 27.6, 32.7, 47.1, 51.7, 112.0, 112.7, 114.7, 118.6, 125.3, 125.7, 125.8, 127.0, 127.4, 128.6, 129.3, 130.4, 130.6, 131.5, 132.3, 133.1, 133.2, 133.7, 134.5, 140.2, 140.5, 150.2, 157.3, 168.1 |
515 |
|
Lukas J26 |
261–263 |
1H-NMR (CDCl3, 600 MHz ppm) δ 8.36 (d, J 7.7 Hz, 1H), 8.01 (d, J 7.7 Hz, 1H), 7.49 (t, J 7.3 Hz, 1H), 7.43 (t, J 7.4 Hz, 1 H), 7.38 (d, J 7.2 Hz, 1H), 7.28-7.34 (m, 5H), 7.15 (d, J 7.7 Hz, 2H), 7.04 (s, 1H), 6.97 (s, 1H), 5.38 (s, 2H), 3.71 (s, 3H), 3.10 (t, J 7.7 Hz, 2H), 2.68 (s, 3H), 1.96 (sext, J 7.7 Hz, 2H), 1.13 (t, J 7.3 Hz, 3H) |
13C NMR (CDCl3, 151 MHz, ppm) δ 171.1, 156.4, 153.9, 143.5, 142.7, 141.7, 141.0, 135.5, 134.5, 133.9, 133.7, 130.4, 130.2, 129.3, 128.9, 128.8, 127.4, 127.0, 123.5, 123.1, 123.1, 121.8, 119.7, 111.2, 109.4, 48.7, 31.7, 30.0, 22.4, 16.9, 14.1 |
513.2
|
|
Srinivas Ambati33 |
260–262 |
1H NMR (CDCl3,400 MHz, ppm) δ 12.8 (1H, s, COOH), 8.42 (1H, d, J 8.0 Hz, ArH), 8.02 (1H, d, J 8.0 Hz, ArH), 7.52-7.28 (8H, m, ArH), 7.20 (2H, d, J 8.0 Hz, ArH), 7.05 (1H, s, ArH), 6.96 (1H, s, ArH), 5.42 (2H, s, CH2), 3.82 (3H, s, CH3), 2.97 (2H, t, J 7.6 Hz, CH2), 2.74 (3H, s, CH3), 1.92 (2H, m, J 7.6 Hz, CH2), 1.04 (3H, t, J 7.6 Hz, CH3) |
13C NMR (DMSO-d6,100 MHz, ppm) δ 13.5, 16.7, 20.6, 27.6, 32.7, 47.1, 51.7, 112.0, 112.7, 114.7, 118.6, 125.3, 125.7, 125.8, 127.0, 127.4, 128.6, 129.3, 130.4, 130.6, 131.5, 132.3, 133.1, 133.2, 133.7, 134.5, 140.2, 140.5, 150.2, 157.3, 168.1.
|
515 |
|
Alex D37,38 |
---- |
1H NMR (CDCl3, 400 MHz, ppm) δ 8.41 (d, 1H), 8.04 (d, 1H), 7.00-7.52 (m, 12H), 5.43 (s, 2H), 3.76 (s, 3H), 3.16 (t, 2H), 2.73 (s, 2H), 2.02 (m, 2H), 1.18 (t, 3H)
|
13C NMR (CDCl3, 400 MHz, ppm) δ 172.9, 158.2, 155.7, 145.2, 144.5, 143.3, 142.7, 137.2, 136.2, 135.6, 135.3, 132.1, 131.9, 131.0, 130.6, 130.4, 129.0, 128.8, 125.2, 124.9, 124.8, 123.5, 121.4, 113.0, 111.0, 50.5, 33.5, 31.7, 24.1, 18.6, 15.8 |
515.2468 |
|
Srirami Reddy25 |
---- |
1H NMR (CDCl3, 400MHz, ppm) δ 12.8 (s, 1H), 7.05-7.5 (m, 14H), 5.60 (s, 2H), 3.82 (s, 3H), 2.97 (t, J ) 7.5, 2H), 2.63 (s, 3H), 1.88 (q, J ) 7.3, 2H), 1.04 (t, J ) 7.3, 3H); |
13C NMR (DMSO-d6 400 MHz, ppm) δ 13.5, 16.7, 20.6, 27.6, 32.7, 47.1, 51.7, 112.0, 112.7, 114.7, 118.6, 125.3, 125.7, 125.8, 127.0, 127.4, 128.6, 129.3, 130.4, 130.6, 131.5, 132.3, 133.1, 133.7, 134.5, 140.2, 140.5, 150.2, 157.3, 168.1. |
515 |
|
Challa Nageswar Rao32 |
260–262 |
1H NMR (CDCl3, 400 MHz, ppm) δ 12.6 (s, 1H), 7.05-7.5 (m, 14H), 5.86 (s, 2H), 4.0 (s, 3H), 2.5 (t, 2H), 3.08 (s, 3H), 1.84 (q, 2H), 0.99 (t, 3H). |
|
515 |
|
Premchand36 |
260–262 |
1H NMR (DMSO-d6, 400 MHz, ppm) δ 0.98-1.03 (t,3H), 1.73- 1.86 (m, 2H), 2.5 - 2.63 (s, 3H), 2.90-2.95 (s, 2H),3.82 (s, 3H), 5.62 (s, 2H), 7.16-7.34 (m,7H), 7.40-7.59 (m,4H), 7.68-7.70 (m, 3H), 12.86 (s, 1H). |
|
515.50 |
Conclusions
Telmisartan is a potent, insurmountable AII receptor antagonist that shows high selectivity for the AT1 receptor subtype. The present study has been particularly focused a better understanding on different synthetic routes adopted for the preparation of telmisartan scaffold. This article tells about the various cost effective and yield improved methodologies for the total synthesis of Telmisartan.
Acknowledgements
The authors acknowledges the IIT Mandi, Himachal Pradesh for providing necessary facilities.
Notes and References
*Corresponding Author Details: V. S. V. Satyanarayana, ReaxZen Healthcare Pvt. Ltd., Boduppal, Hyderabad 500039, India.
E-mail id.: This email address is being protected from spambots. You need JavaScript enabled to view it.
† Supporting Information (SI): Not available.
1. W. Wienen, N. Hauel, J. C. A. Van Meel, B. Narr, U. Ries and M. Entzeroth, Brit. J. Pharmacol. 1993, 110, 245.
2. K. J. McClellan and A. Markham, Drugs, 1998, 56, 1039.
3. A. J. Battershill and L. J. Scott, Drugs, 2006, 66, 51−83.
4. M. Schupp, J. Janke, R. Clasen, T. Unger and U. Kintscher, Circulation, 2004, 109, 2054.
5. S. C. Benson, H. A. Pershadsingh, C. I. Ho, A. Chittiboyina, P. Desai, M. Pravenec, N. Qi, J. Wang, M. A. Avery and T. W. Kurtz, Hypertension, 2004, 43, 993.
6. M. Miura, S. Satoh, H. Kagaya, M. Saito, T. Inoue, T. Ohkubo, T. Habuchi and T. Suzuki, J. Clin. Pharm. Ther., 2009, 34, 683.
7. T. W. Kurtz, Acta Diabetol., 2005, 42, S9.
8. http://www.boehringer-ingelheim.com/corporate_profile/ history/history3.html
9. http://www.rxlist.com/cgi/generic2/telmisartan.htm.
10. H. Kakuta, K. Sudoh, M. Sasamata and S. Yamagishi, Int. J. Clin. Pharmacol. Res., 2005, 25, 41.
11. W. Kirch, B. Horn and J. Schweizer, Eur. J. Clin. Invest., 2001, 31, 698.
12. M. A. Ondetti and D. W. Cushman, J. Med. Chem., 1981, 24, 355.
13. G. Berellini, G. Cruciani and R. Mannhold, J. Med. Chem., 2005, 48, 4389.
14. P. C. Wong, T. B. Barnes, A. T. Chiu, D. D. Christ, J. V. Dunica, W. F. Herblin and P. B. M. W. M. Timmermans, CardioVasc. Drug ReV. 1991, 9, 317.
15. D. J. Carini and J. V. Duncia, Eur. Pat. Appl. EP0253310A2, 1998.
16. W. Wienen, M. Entzeroth, J. C. A. van Meel, J. Stangier, U. Busch, T. Ebner, J. Schmid, H. Lehmann, K. Matzek, J. Kempthorne-Rawson, V. Gladigau and N. H. Haul, Cardiovasc. Drug Rev., 2000, 18, 127.
17. D. Sylvia, R. H. Beoger, J. Weiss and R. A. Benndorf, Expert Opin. Drug Metab. Toxicol., 2010, 6, 863.
18. R. A. Benndorf, T. Rudolph, D. Appel, E. Schwedhelm, R. Maas, F. Schulze, E. Silberhorn and R. H. Bfger, Metabolism- Clinical and Experimental., 2006, 55, 1159.
19. J. M. Mallion, J. P. Siche and Y. Lacourcière, Hypertension, 1999, 13, 657.
20. R. M. Salama, M. F. Schaalan, M. E. Ibrahim, A. E. Khalifa and A. A. Elkoussi, Open Journal of Endocrine and Metabolic Diseases, 2013, 3, 186.
21. D. Ganesh, S. Anoop, H. Mrunalini, M. Mohini, H. Sachin and S. Abhijit, Int. J. Pharmacol. Res., 2015, 5, 80.
22. D. Fukuda, S. Enomoto, Y. Hirata, R. Nagai and M. Sata Biomed. Pharmacother., 2010, 64, 712.
23. K. Araki, T. Masaki, I. Katsuragi, K. Tanaka, T. Kakuma and H. Yoshimatsu, Hypertension, 2006, 48, 51.
24. U. J. Ries, G. Mihm, B. Narr, K. M. Hasselbach, H. Wittneben, M. Entzeroth, J. C. A. Van Meel, W. Wienen, N. H. Hauel, J. Med. Chem., 1993, 36, 4040.
25. K. S. Reddy, N. Srinivasan, C. R. Reddy, K. Naveenkumar, Y. A. S. Venkatraman, A. Bhattacharya and T. M. Vijayavitthal, Org. Process Res. Dev., 2007, 11, 81.
26. J. Lukas and K. Thomas, J. Org. Chem., 2008, 73, 8631.
27. K. R. Narayanrao, D. R. Rao, P. L. Srinivas and P. Ravikumar, US Patent US 2008/0015359 A1, 2008.
28. A. S. Kumar, S. Ghosh, G. N. Mehta, R. Soundararajan, P. S. R. Sarma and K. Bhima. Synthetic Commun., 2009, 39, 4149.
29. A. S. Kumar, S. Ghosh, R. Soundararajan and G. N. Mehta, ARKIVOC, 2009, (x), 247.
30. A. S. Kumar, S. Ghosh and G. N. Mehta, Arch. Appl. Sci. Res., 2010, 2, 135.
31. A. S. Kumar, S. Ghosh and G. N. Mehta, Beilstein J. Org. Chem., 2010, 6, 25.
32. C. N. Rao, T. Naresh, K. Satyanarayana, B. R. Reddy and G. M. Reddy, Synthetic Commun., 2010, 40, 530.
33. A. Srinivas, P. H. Rao, T. V. Maruthikumar, N. Sreenivasan, A. N. Babu, Der. Chemica. Sinica., 2011, 2, 151.
34. P. Wang, Z. Guo-jun, W. Ya-ping, W. Xiang-jing, W. He-geng and X. Wen-sheng, Tetrahedron, 2012, 68, 2509.
35. L. Chakrapani, K. N. Raju, K. Sridhar, M. S. P. Sarma and B. N. Choudary, WO Patent WO2012/028925 A2, 2012.
36. B. P. Premchand, P. Anand, B. S. Devanand and B. R. Chaudhari, Int. J. Res. Pharm. Biomed. Sci., 2013, 4, 293.
37. D. M. Alex, R. S. Ali, B. Katherine and B. F. Gupton, J. Org. Chem., 2015, 80, 1915.
38. D. M. Alex, R. S. Ali, B. Katherine and B. F. Gupton, J. Flow. Chem., 2015, 5, 145.
39. https://pubchem.ncbi.nlm.nih.gov/compound/Telmisartan #section=UNII
40. http://www.drugbank.ca/drugs/DB00966
41. http://www.chemicalbook.com/ChemicalProductProperty _EN_CB4266172.htm
- Author(s): Derin Mary Thomas and A. S. Arun Prasad
- Category: HTML FullText
- Published: 31 January 2017
Microbial Decolorization of Azo Dyes ̶ A Mini Review
A. S. Arun Prasada,*, Gaurav Kumara and Derin Mary Thomasb
aDepartment of Biomedical Sciences, School of Biosciences and Technology, VIT University, Vellore, India.
bDepartment of Integrative Biology, School of Biosciences and Technology, VIT University, Vellore, India.
Published Online 19 01 2017
The continuous development of industries has resulted in the increase of wastewater leading to consequential decline in levels and quality of natural water in the ecosystem. The textile industries have increased in many of the countries and have shown a significant increase in the use of synthetic complex organic dyes as colouring material. Release of waste waters from the textile industries is a problem in many parts of the world especially the discharge of coloured effluents into the environment is undesirable as many of the dyes and their breakdown products are toxic or mutagenic. Azo dyes are commonly used in textile industries and due to their complex structure they are highly persistent in natural environments. Most of the physicochemical dye removal methods generally used for effluent treatment have many limitations. The treatment of textile dyeing wastewaters has become a challenging task. Microbial decolorization and metabolism of azo dyes has long been known and bioremediation technology has attracted interest. This review paper discusses the abilities of diverse categories of microorganisms (bacteria, yeasts and fungi) in decolorizing and degrading structurally different azo dyes under varying physiochemical conditions. This review also discusses different conditions for azo dye decolorization (aerobic, anaerobic and anoxic) and the various mechanisms adopted by the microbes for metabolism of azo dyes.
INTRODUCTION
The The Environment we live in is composed of atmosphere, earth, water and space. This natural environment in the absence of pollution remains clean and amicable. The composition and complex nature of this stable environment was altered as a result of various human activities such as industrialization, construction and transportation. These major activities though desirable for human development and welfare, have led to the production and release of different kinds of contaminants into the environment causing instability and disorder. A combination of such kinds of unfavourable changes in the environment results in what is known as Environmental Pollution. Our biosphere is under constant threat from continuing environmental pollution. Over the last three decades there has been an increasing global concern over the impact of pollution on the environment. Continuing population growth, urbanization and rapid industrialization has led to a dramatic increase in the demand for water resources and increased the intensity in the discharge of contaminated or wastewater around the world 1. The textile industry is one of the largest and oldest contributing sectors to many Asian economies and the most important in terms of revenue generation. The Indian textile industry accounts for 14% of industrial production, employs 35 million people and accounts for approximately 12% of country’s total export business. With the increased demand for textile products, the textile industry and its wastewaters have been increasing proportionally, making it one of the main sources of severe pollution problems worldwide.2 Textile industries consume large volumes of freshwater for its various wet processes of textile manufacturing and generate equal amounts of wastewater. In addition, the chemical reagents used in textile industries are very diverse in chemical composition ranging from inorganic compounds to polymers and organic products.3,4 Textile wastewaters generated from the different wet processes are characterized by high pH, temperature, BOD (Biological Oxygen Demand), COD (Chemical Oxygen Demand), detergents, metals, surfactants, suspended and dissolved solids, dispersants, levelling agents, toxic organics (phenols), chlorinated compounds (AOX), sulphide and formaldehyde, may be
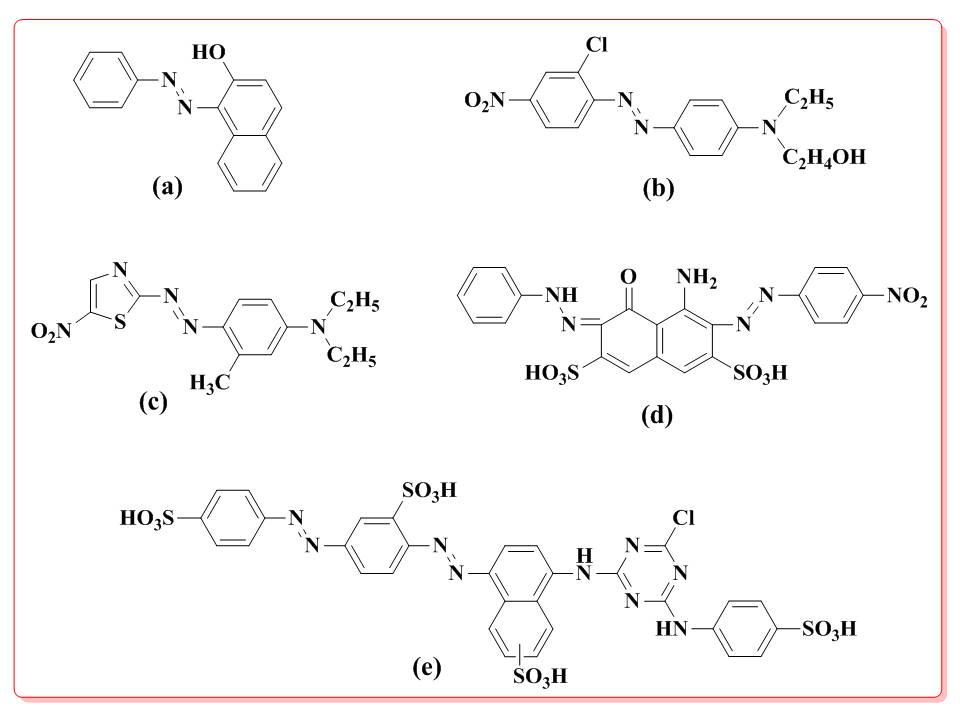
Figure 1. Structures of Azo dyes. (a) Disperse Red 13 (b) Disperse Blue (c) Reactive Brown 1 (d) Direct Green 26 (e) Acid Black 1.
added to improve dye adsorption onto the fibres. The most common textile-processing set up consists of desizing, bleaching, mercerising and dyeing processes.5,6 Dyeing is the process of adding colour to the fibres, which normally requires large volumes of water not only in the dyebath, but also during the rinsing step. The textile industries use a number of coloured complexes known as dyes, which impart colour to the fabric. A dye is a colored substance that has an affinity to the substrate to which it is being applied.
The dyes possess colour because they 1) absorb light in the visible spectrum (400–700 nm), 2) have at least one chromophore (colour-bearing group), 3) have a conjugated system, i.e. a structure with alternating double and single bonds, and 4) exhibit resonance of electrons, which is a stabilizing force in organic compounds.7 In addition to chromophores, most dyes also contain an electron withdrawing or donating substituents known as auxochromes (colour helpers). These auxochromes intensify the color of the compounds and provide bonding affinity groups.8 The most important chromophores are azo (–N=N–), carbonyl (–C=O), methine (–CH=), nitro (–NO2) and quinoid groups. The common auxochromes include amine (–NH2), carboxyl (–COOH), sulfonate (–SO3H) and hydroxyl (–OH). These chromophores and auxochromes together form the basis for the classification of dyes. The dyes were classified into several groups such as azoic dyes, basic dyes, direct dyes, disperse dyes, acid dyes, reactive dyes, solvent dyes, sulphur dyes and vat dyes.9 These synthetic dyes are extensively used in textile dyeing, paper printing, colour photography, pharmaceutical, food, cosmetic and leather industries.10-12 Among these, the textile industries have shown a significant increase in the use of synthetic complex organic dyes as the colouring material. Over 105 commercially available dyes exist and more than 7×10⁵ tonnes of dyestuff are produced annually.13,14 It is estimated that 280,000 tons of textile dyes are discharged in textile industrial effluent every year worldwide.15
AZO DYES
Azo dyes comprise by far the largest family of organic dyes commonly used in textile, food, paper making and cosmetic industries.16 Azo dyes are characterized by the presence of one or more azo groups (R1-N=N-R2). As per 1994 estimates more than half of the annually produced amounts of dyes are azo dyes making them the largest and versatile class of dyes being employed in textile industries.17,18 Presumably more than 2,000 different azo dyes are currently used to dye various materials such as textiles, leather, plastics, cosmetics and food. Generally azo dyes are composed of one or more azo linkages, substituted with a combination of functional groups including triazine amino, chloro, hydroxyl, methyl, nitro and sulphonated.19 The largest amount of azo dyes is used for the dyeing of textiles, of which nearly 10–15 % dyestuff remains unbound to the fibre and is therefore released into the environment leading to severe contamination of surface and ground waters
Table 1. Advantages and disadvantages of current methods of dye removal from industrial effluents.
|
Physical/Chemical methods |
Advantages |
Disadvantages |
|
Fenton’s reagent |
Effective decolorization of both soluble and insoluble dye |
Sludge generation |
|
Ozonation |
Applied in gaseous state; no alteration in volume |
Short half life |
|
Oxidation |
Rapid process |
High energy costs and formation of unwanted by-products |
|
NaOCl |
Initiates and accelerates azo bond cleavage |
Release of aromatic amines |
|
Adsorption |
Good removal of a wide range of dyes, simple can operate continuously |
Adsorbent requires regeneration or disposal |
|
Photochemical |
No Sludge production |
Formation of bi-products |
|
Cucurbituril |
Good sorption capacity for various dyes |
High operating cost |
|
Electrochemical destruction |
Breakdown compounds are non-hazardous |
High cost of electricity |
|
Activated carbon |
Good removal of variety of dyes |
Very expensive to operate |
|
Peat |
Good adsorbent due to cellular structure |
Specific surface areas for adsorption are lower than activated carbon |
|
Wood chips |
Good sorption capacity for acid dyes |
Requires long retention times |
|
Silica gel |
Effective for basic dye removal |
Side reactions prevent commercial applications |
|
Membrane filtration |
Removes all dye types |
Concentrated sludge production |
|
Ion exchange |
Regeneration; no adsorbent loss |
Not effective for all dyes |
|
Irradiation |
Effective oxidation at lab scale |
Requires a lot of dissolved O2 |
|
Electro kinetic coagulation |
Economically feasible |
High sludge production |
in the vicinity of dyeing industries.20-22 Azo dyes are known to prevalent environmental contaminants, and pose a significant risk to human and environmental health. Some examples of azo dyes and their chemical structures are shown in Figure 1.
Most of the azo dyes are non-toxic except for some azo dyes with free amino groups. These compounds lead to high electrolyte and conductivity concentrations in the dye wastewater, leading to acute and chronic toxicity problems.23 Occupational sensitisation to azo dyes has been reported in the textile industry.24 Many of the azo dyes and their degradation intermediates are mutagenic and carcinogenic25,26 and contribute to the mutagenic activity of ground and surface waters that are polluted by textile effluents.27-29 Furthermore, dye containing effluents increase biochemical oxygen demand of the contaminated water.30 Therefore, the removal of colour from textile dyeing effluents is vital before their discharge into surrounding environment..31 Mounting pressure on the textile industry to treat dye house effluents has led to a host of new and old technologies competing to provide cost-effective solutions.
TREATMENT TECHNOLOGIES
There is no universal method for the removal of colour from the dye wastewater.32 Due to variation in dye waste water characteristics a number of physical, chemical and biological treatment methods have been employed for its treatment. A number of treatment technologies are available for the remediation of dye waste waters. These include physicochemical methods like membrane filtration, coagulation/flocculation, precipitation, flotation, adsorption, ion exchange, ion pair extraction, ultrasonic mineralization, electrolysis, advanced oxidation (chlorination, bleaching, ozonation, Fenton oxidation and photocatalytic oxidation) and chemical reduction.33-35 The coagulation-flocculation method is one of the widely used processes in textile wastewater treatment plants in countries such as Germany and France. It could be used either as a pre-treatment, post-treatment, or even as main treatment system.36 The chemical oxidation process typically involves the use of an oxidising agent such as ozone (O3), hydrogen peroxide (H2O2) and permanganate (MnO4) to change the composition of a compound.37. A process called selective oxidation, ozone can be designed in such a way that only N=N bond scission occurs. Besides, different advantages, physicochemical techniques have also some serious restrictions such as high cost, low efficiency, limited versatility, interference by other wastewater constituents, and the handling of the waste generated.38-41 Thus, the removal of colour from textile effluents has been a major concern and there is a great need to develop an economic and effective way of dealing with the textile dyeing waste in the face of ever increasing production activities.42
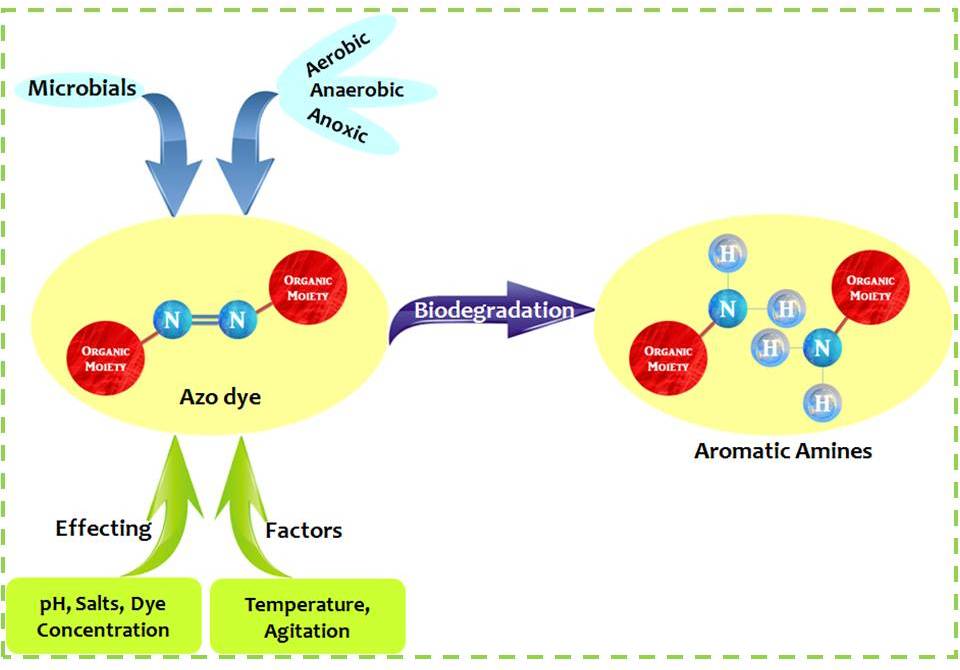
Figure 2. Graphical representation of basic approach for Microbial degradation of Azo dyes.
This has resulted in considerable interest in the use of biological systems for the treatment of these wastewaters. These different physico-chemical methods have their own advantages and disadvantages which are summarised in the Table 1.38
BIOLOGICALTREATMENT/BIOREMEDIATION
The use of biological methods to bring about remediation of contaminated sites is known as Bioremediation. Bioremediation is a treatment process that uses naturally occurring microorganisms (bacteria, yeast or fungi) to break down, or degrade, hazardous substances into less toxic or nontoxic substances. Biological methods are known to be environmentally friendly as they bring about complete mineralization of organic pollutants at low cost and produce low sludge.43,44 Biological dye removal techniques are based on microbial biotransformation of dyes. Biodegradation of synthetic dyes not only results in decolorization of the dyes but also in fragmentation of the dye molecules into smaller and simpler parts (breakdown products). Azo dyes are known to be xenobiotic in nature and hence are recalcitrant to biodegradation in conventional activated sludge treatment units.45,46 Microorganisms play a remarkable role in decomposition and ultimate mineralization of various azo dyes.47 Bioremediation techniques utilise microorganisms to treat contaminants by degrading organic compounds to less toxic materials, such as CO2, methane, water and inorganic salts. This is an energy dependent process involving the breakdown of dye into different by-products through the action of various enzymes.41 These techniques can be carried out in situ or ex situ under aerobic or anaerobic conditions. Bioremediation of dyeing effluents is considered as a good alternative treatment method due to the extreme variation in composition of textile effluents. Biological methods also offer potential advantages over conventional processes in terms of minimum impact on environment and cost effectiveness.48 A number of microorganisms including fungi, bacteria, yeasts, and algae have been employed for the decolorization and degradation of synthetic dyes. Their degrading potential varied with different kinds of dyes. The effectiveness of microbial degradation mainly depends upon the adaptability and activity of particular microrganisms.49 The degradation potential of a selected strain is enhanced by its application under favourable conditions .50
BACTERIAL DECOLORIZATION OF AZO DYES
The effectiveness of microbial decolorization depends on the adaptability and the activity of the selected microorganisms.49 Several microorganisms including bacteria, fungi, yeasts and algae, can decolorize and even completely mineralize many azo dyes. Bacterial decolorization of azo dyes has gained importance in recent times as they are easy to culture and grow more quickly.51 The role of diverse groups of the bacteria in the decolorization of azo dyes was been extensively studied. Bacterial decolorization of azo dyes is more efficient and faster.52 Decolorization of azo dyes occurs under anaerobic, anoxic and aerobic conditions or in different combinations by various trophic groups of bacteria. The initial step in the bacterial degradation of azo dyes is the reductive cleavage of the azo bond (-N=N-). Anaerobic conditions are found to be favourable and more satisfactory for the reduction of azo dyes than aerobic degradation,16 but the resulting intermediate compounds (aromatic amines) are biorecalcitrant under anaerobic conditions and can be toxic and carcinogenic.18,53 The aromatic amines generated have to be degraded by an aerobic process 54,55 prior to their final discharge to the environment. Hence, the aerobic or at times the anoxic treatment is the only safe method for the biodegradation of azo dyes. Aerobic processes have been recently employed for the treatment of textile wastewater as standalone processes and it is confirmed that they are efficient and cost effective.56 The most rapid and complete degradation of the majority of pollutants is brought about under aerobic or anoxic conditions. Bacteria are seldom able to decolorize azo compounds in the presence of oxygen; only organisms with specialized azo dye reducing enzymes were capable of degrading azo dyes under fully aerobic conditions, as a result very few reports exists on the aerobic decolorization of azo dyes. 57-60 Many of these isolates require organic carbon sources as they cannot utilize dye as the growth substrate.18 Figure 2 shows the graphical representation of microbial degradation of azo dyes.
Many studies had been carried out to assess the role of diverse group of bacteria in the decolorization of dyes. Bacterial decolorization is normally faster in comparison to fungal decolorization.52 The initial step of the bacterial degradation of azo dyes is the reductive cleavage of the –N=N– bond. Bacterial decolorization of azo dyes occurs under anaerobic (methanogenic), anoxic and aerobic conditions by different groups of bacteria. Isolation of bacterial cultures capable of azo dye degradation started in the 1970’s with the report of Bacillus subtilis 61 followed by Aeromonas hydrophila 62 and by a Bacillus cereus.53 Several other decolorizing Pseudomonas and Aeromonas species were later reported by a Japanese group.63,64 A host of bacterial cultures such as Rhodococcus sp. Bacillus cereus, Plesiomonas sp. and Achromobacter sp. capable of dye decolorization were reported by.65 Recently, biodegradation of malachite green by Micrococcus sp. strain BD15, its biodegradation pathway and enzyme analysis was assessed.66 A bacterial strain isolated from soil samples around textile factory and identified as Bacillus sp. YZU1 exhibited remarkable ability to decolorize Reactive Black 5.67 An alkaliphilic and halotolerant facultative anaerobe Planococcus sp. MC01 efficiently reduced Orange I under alkaline and anaerobic conditions.49 Biological decolorization of malachite green by Deinococcus radiodurans R1 was achieved with higher efficiency and in short time.68
BIODEGRADATION OF DYES BY FUNGI
A wide range of aromatics and synthetic dyes are being readily degraded by white rot fungi.12 White rot fungi produce efficient enzymes (lignin peroxidase, manganese peroxidase and laccase) which are capable of decomposing dyes under aerobic conditions. The first report on dye degradation by white rot fungi was in the year 198369 and has been the main subject of research since then. The extracellular non-specific and non-stereoselective enzyme system comprising lignin peroxidase (LiP), manganese peroxidases (MnP) and laccases 11,70 are responsible for the decolorizing activity of synthetic dyes by ligninolytic fungi. The extracellular enzymes of fungi are known to be able to degrade complex synthetic dyes.71 White-rot fungi are the most intensively studies dye decolorizing microorganisms.
BIODEGRADATION OF DYES BY YEASTS
Scanty reports are available on decolorization of dyes by yeasts.11,72,73 Yeasts have advantages in growing rapidly like bacteria, but like filamentous fungi, and also have the ability to resist unfavourable conditions. Maximum colour removal of 98% of Remazol Black-B was achieved with the yeast Kluyveromyces marxianus IMB3.74 A couple of simple azo dyes were degraded in batch cultures by a strain of yeast Candida zeylanoides 75.
BACTERIAL DECOLORIZATION UNDER ANAEROBIC CONDITIONS
Most of the bacteria degrade the azo dyes reductively under anaerobic conditions to colourless aromatic amines. Dye decolorization under anaerobic conditions is dependent on the added organic carbon source and the dye structure. Simple substrates like starch, acetate, ethanol, glucose have been used for dye decolorization under methanogenic conditions. 76-79 Members of the Gamma Proteobacteria combined with sulphate reducing bacteria were found to be prominent members of mixed bacterial populations in an anaerobic baffled reactor treating industrial dye wastes. Reduction of dyes under anaerobic conditions seems to be unspecific as the rate of decolorization depends on the added organic carbon source as well as the dye structure. 80,18
BACTERIAL DECOLORIZATION UNDER ANOXIC CONDITIONS
A number of mixed aerobic and facultative anaerobic microbial consortia were been reported to decolorize azo dyes under anoxic conditions.81-85 Most of these cultures though show growth under aerobic conditions, decolorization was achieved only under anaerobic conditions. Pure bacterial isolates such as Pseudomonas luteola, Aeromonas hydrophila, Bacillus subtilis, Pseudomonas sp. and Proteus mirabilis were found to decolorized azo dyes under anoxic conditions.86-88 Decolorization of azo dyes by pure and mixed cultures usually requires complex organic sources such as peptone, yeast extract or a combination of complex organic sources 49,81 Glucose was found to be the preferred substrate in the anaerobic dye decolorization but its use in anoxic conditions seems to vary based on the culture. Mordant Yellow 3 decolorization by Sphingomonas xenophaga was enhanced greatly in the presence of glucose and decrease in decolorization was observed in its presence for Pseudomonas leuteola, Aeromonas sp. and few other mixed cultures.89,84,59
BACTERIAL DECOLORIZATION UNDER AEROBIC CONDITIONS
Several bacterial isolates were isolated during the past years which could aerobically decolorize many azo dyes. Many of these isolates could not utilize dye as growth substrate and require organic carbon sources. Pseudomonas aeruginosa decolorized Navitan Fast Blue S5R in the presence of glucose under aerobic conditions and also decolorized various other azo dyes.90 Only a couple of bacteria were found to utilize dye as their sole source of energy. These bacteria reductively cleave –N=N– and utilize the formed aromatic amines as their source of energy. Some of the isolates possessing this trait are Xenophilus azovorans KF 46 (Previously Pseudomonas sp. KF46) and Pigmentiphaga kullae K24 (previously Pseudomonas sp. K24), which can grow aerobically on carboxy-orange I and carboxy-orange II.91, 92 Likewise, an obligate aerobe Sphingomonas sp. strain 1CX was isolated which utilised AO7 as sole carbon, energy and nitrogen source and decolorized it.93 The isolates Bacillus sp. OY1-2, Xanthomonas sp. NR 25-2 and Pseudomonas sp. PR41-1 was also found to utilize AO7 or Acid Red 88 as sole carbon source.94 In another report, two isolates identified as Vibrio logei and P. nitroreducens were found to utilize methyl red as sole source of energy.57
ANAEROBIC / AEROBIC BIODEGRADATION OF DYES
In order to overcome the problem of recalcitrance of azo dye breakdown products under anoxic conditions, a two stage treatment process is being suggested.95,20 The first step includes the reductive cleavage of azo bond under anaerobic conditions resulting in colourless aromatic amines, which are then easily metabolized under aerobic conditions. Complete mineralization of azo dye Mordant Yellow 3 was obtained by Sphingomonas sp. BN6 co-immobilised with an uncharacterised 5-aminosalicylate degrading isolate with alginate beads. The anaerobic/aerobic treatment process can be carried out sequentially or simultaneously. The sequential processes combine the anaerobic and aerobic steps in the same reaction vessel. The simultaneous systems utilize anaerobic zones within the aerobic bulk phases, as in biofilms, granular sludge, and biomass immobilized in other matrices.96,97
BIODEGRADATION OF DYES BY MIXED MICROBIAL CULTURES
With the ever increasing complexity in the structures of xenobiotics it is not possible to find complete catabolic pathways in a single microorganism. A higher degree of biodegradation and complete mineralization can be achieved only when cometabolic activities within a microbial community complement each other. 98,44 The synergistic activity of microbial communities is known to be responsible for the higher degree of mineralization of dyes and also offers considerable advantages over the use of pure cultures.99 Most of the studies have reported the effectiveness of microbial consortium over pure isolates.11 The individual isolates of the consortium may target the dye molecule at different positions or utilise the products of decomposition generated by another strain to further the decomposition.54 89 described a bacterial consortium capable of mineralizing the sulphonated azo dye Mordant Yellow. Therefore, the process of biodegradation of dyes may be enhanced using mixed microbial cultures due to their synergistic property.
FACTORS AFFECTING BIODEGRADATION OF DYES
The natural ecosystem is a dynamic environment with varying abiotic conditions, like pH, Temperature, presence of oxygen, metals, salts etc. The highly variable nature of the biological treatment systems and the dyeing effluents, a number of factors are known to affect the biodegradation rate of azo dyes. Many researchers have discussed problems associated with dye biodegradation which are least anticipated. Microorganisms playing a major role in the global C, N and S cycles are affected by changes in these parameters and as a result their potential to decompose is also being affected. Thus the effects of these parameters are vital for evaluating the potential of various microorganisms for degrading particular xenobiotics. Therefore, optimization of such conditions would greatly help in the development of large scare bioreactors for the efficient treatment of textile dyeing effluents and for the bioremediation of contaminated sites.
EFFECT OF pH
Fungi and yeast exhibit better decolorization and biodegradation activity at acidic or neutral pH while bacteria at neutral or basic pH. The functioning of anaerobic and aerobic microorganisms is affected by the pH of the wastewater. Decolorization of Reactive Black 5 by Enterobacter sp. EC3 was found to be higher at pH 7.0 after 108 h of incubation. Similar efficiency of decolorization was noticed from pH 8.0 –12.0 in 120 h, but decolorization rate was much lower at acidic conditions (pH 4.0 and 6.0). This phenomenon could be due to the fact that the optimum pH for growth of Enterobacter sp. EC3 was neutral.100 Studies on the decolorization of Scarlet R by a microbial consortium GR consisting of Proteus vulgaris NCIM-2027 and Micrococcus glutamicus NCIM-2168 showed the percentage decolorization of 62, 82, 100 and 100 at pH 5, 6, 7 and 8 after 24, 24, 14 and 36 h respectively.73
EFFECT OF TEMPERATURE
Temperature is an important factor affecting ecosystem. The biodegradation activities of microorganisms are affected by the changes in temperature. An optimum temperature is required for the growth and multiplication of the decomposers (mostly soil bacteria and fungi). Beyond the optimum temperature, the activity of degradation decreases due to slow growth and reproduction and deactivation of enzymes responsible for degradation. Decolorization of Navy Blue HER by T. beigelii (yeast) was studies at various temperatures (30–50°C) and decolorization was found to be faster at 37°C within 24 h incubation.73 The decolorization rate of Reactive Black 5 by Enterococcus sp. EC3 was found to increase with rise in temperature from 22°C to 37°C, and was found to be affected drastically at 42°C. Optimum temperature for decolorization was at 37°C.100
EFFECT OF INITIAL DYE CONCENTRATION
The effect of initial dye concentration upon the decolorization of dyes is well researched. The increasing dye concentration brings about decrease in the decolorization rate of dyes. Decolorization rate of Congo Red by Bacillus sp. decreased with increase in dye concentration and at high concentrations (1,500 and 2,000 mg/L) inhibition was observed.101 Enterobacter sp. was unable to grow at high concentrations of Reactive Red 195 (50 and 100 mg/L) as it was dead. The dye was found to be toxic to cells at high dye concentrations.102 Similar toxicity of malachite green to Kocuria rosea MTCC 1532 was observed at higher dye concentrations.103 This toxicity of dyes to the microbial cells results in the decreased production of microbial biomass. The maximum cell growth yield of Aeromonas hydrophila was 1.2-1.6 g/L at dye concentration of 1,000 – 3,000 mg/L of Reactive Red 198, and was found to decrease (0.7–1.0 g/L) at 4,000 – 8,000 mg/L dye concentration.49 The decolorization rate of crystal violet by Nocardia corallina decreased to less than 30% at an increased dye concentration of 4.5 µM.104
EFFECT OF SALTS
The textile effluents are characterized by a number of acids, alkalis, salts, or metal ions as impurities.41 Wastewaters from dyeing units and textile processing industries contain substantial amounts of salts in addition to azo dyes.47 Dyestuff industry wastewaters contain salt concentrations up to 15–20%.5 Thus, employing microbial species capable of tolerating salt stress is mandatory for treating such wastewaters. The ability of Shewanella putrefaciens strain AS96 in decolorizing four structurally different azo dyes at different concentrations of NaCl was assayed.47 The azo dyes Reactive Black 5, Direct Red 81, Acid Red 88 and Disperse Orange 3 were decolorized with 100% efficiency when NaCl concentration was 0-40 g/L. Time for decolorization increased with rise in NaCl concentration (60 g/L) and percent decolorization also decreased significantly.
EFFECT OF AGITATION
Contradictory reports exist on the effect of shaking / agitation on microbial decolorization of synthetic dyes. Some authors reported decolorization under shaking conditions and some under static conditions. Higher colour removal is observed under shaking cultures due to better oxygen transfer and distribution of nutrients as compared to stationary cultures. In contrast, agitated cultures of Pseudomonas sp. SUK1 showed almost no decolorization in 24 h, whereas static cultures exhibited more than 96% decolorization.52 Enzymatic activity of static cultures was found to be high.41 Rate of ligninolytic enzymes and the rate of decolorization increased during the decolorization of Reactive Orange 16 and Remazol Brilliant Blue R by Irpex lacteus. Maximal enzyme activity of MnP, laccase, and LiP was noticed after 7 days under static conditions (Novotny et al., 2004). The growth and decolorization of T. beigelii was found to be high under static conditions compared to shaking condition.101
MECHANISM OF AZO DYE REDUCTION
The primary step in the bacterial degradation of azo dyes in either anaerobic or aerobic conditions, is the reduction of the –N=N– bond. This reduction may involve different mechanisms, such as enzymes, low molecular weight redox mediators, chemical reduction by biogenic reductants like sulfide or a combination of these (Figure 3). The formed intermediate metabolites are further degraded either anaerobically or aerobically. The presence of oxygen usually inhibits the azo bond reduction as aerobic respiration dominates the utilization of NADH; thus obstructing the transfer of electrons from NADH to azo bonds.105
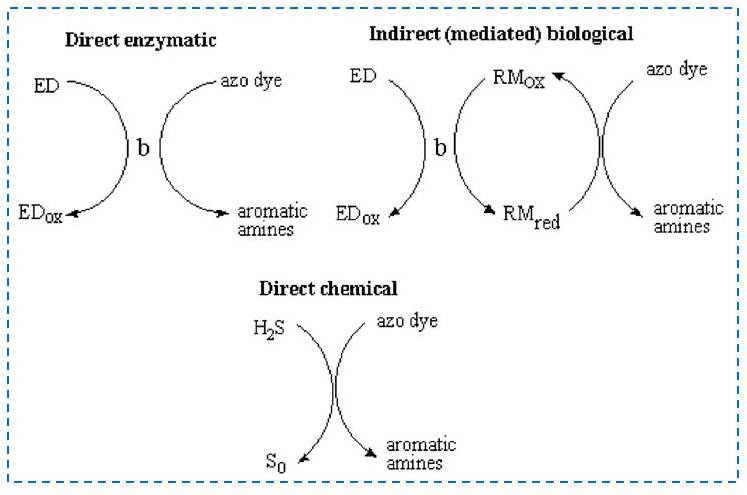
Figure 3. Mechanism of Azo dye reduction.44
DIRECT ENZYMATIC REDUCTION OF AZO DYES
This mechanism involves the transfer of reducing equivalents enzymatically generated from the oxidation of the substrate/coenzyme to azo dyes. These enzymes could be specific catalysing only the azo dye reduction, or nonspecific. The nonspecific enzymes catalyze a wide range of substrates. Due to their non-specificity these enzymes readily reduce azo dyes.
ENZYMATIC AZO DYE REDUCTION UDNER ANAEROBIC CONDITIONS
Presence of azoreductases in anaerobic bacteria which decolorized sulphonated azo dyes during growth on solid or complex media was reported by10 These isolates were reported from Clostridium and Eubacterium. The azoreductases were found to be oxygen sensitive and released extracellularly. Further investigations with C. perfringens showed the azo dye reduction was catalyzed by flavins adenine dinucleotide dehydrogenase reducing nitro aromatic compounds.106 Another dye decolorization mechanism involves cytosolic flavin dependent reductases which transfer electrons via soluble flavins to azo dyes. A recent study by107 with a recombinant Sphingomonas strain BN-6 showed the reduction of sulphonated azo dye by cytosolic flavin-dependent azoreductase was observed in vitro with little importance in vivo.
ENZYMATIC AZO DYE REDUCTION UDNER AEROBIC CONDITIONS
The presence of azoreductases from aerobic bacteria were first proven in the isolates Pseudomonas K22 (reclassified as Pigmentiphaga kullae K24) and Pseudomonas KF46 (reclassified as Xenophilus azovorans KF46F).91,108 These intracellular azoreductases exhibited high specificity to dye structures and cleaved their carboxylated as well as sulfonated structural analogues. Similarly, azoreductases from Bacillus sp. strain OY1-2 readily decolorized AR88 and AO7 and a group of proprietary reactive dyes.109 Two other azoreductases from X.azovorans KF46 and P.kullae were well characterized.110 Nonspecific enzymes responsible for azo dye reduction were been isolated from aerobically grown cultures of Shigella dysenteriae,111 E. coli,112 Bacillus sp.113 Staphylococcus aureus114 and P. aeruginosa.90
Conclusions
Much attention has been focused on the remediation of pollutants discharged into the environment form the various processes of the textile industries. The soils and waters are severely contaminated by the release of synthetic dyes into the environment. The wide ranges in chemical structures of dyes often add up to the complication. Azo dyes being the most important group of synthetic colorants are generally considered xenobiotic and are recalcitrant against biodegradation processes. The treatment of dyeing wastewaters and decolorization presents an arduous task. Among the various methods available for treatment of dyeing effluents, the feasible and cost effective biological methods seems to deliver promising solution. The available literature suggests that a combination of anaerobic-aerobic biological methods may be suitable for treatment of dye-containing wastewaters. However, still there is a need to focus on the basic and applied aspects of bioremediation. In order to effectively use the bioremediation tool for degradation and detoxification of dyes a thorough understanding of microbial genetics, biochemistry and physiology is essential. More concerted efforts are required to establish the microbial decolorization process.
Acknowledgements
The authors acknowledges the management of the VIT University, Vellore for providing necessary facilities. The authors would also like to acknowledge the assistance of Dr. V. S. V. Satyanarayana, IIT Mandi.
Notes and References
* Corresponding Author Details: A. S. Arun Prasad, Department of Biomedical Sciences, School of Biosciences and Technology, VIT University, Vellore, India.
E-mail id.: This email address is being protected from spambots. You need JavaScript enabled to view it.
† Supporting Information (SI) available: Not Available.
1. I. O. Asia, N. A. Oladoja and E. E. Bamuza-Pemu, African J. Biotechnol., 2006, 5, 1678.
2. B. S. Andre dos, J. C. Francisco and B. L. Jules van, Bioresour. Technol., 2007, 98, 2369.
3. I. M. Banat, P. Nigam, D. Singh and R. Marchant, Bioresour. Technol., 1996, 58, 217.
4. R. S. Juang, R. L. Tseng, F. C. Wu and S. J. Lin, J. Environ. Sci. Health A, 1996, 31, 325.
5. Environmental Protection Agency, Profile of the Textile Industry. Washington: EPA, 1997.
6. A. B. Dos Santos, F. J. Cervantes, R. E. Yaya-Beas and J. B. Van Lier, Enzyme Microb. Tech., 2003, 33, 942.
7. E. N. Abrahart, Dyes and their intermediates, (Chemical Publishing: New York) 1977, 1.
8. R. Christie, The Royal Society of Chemistry, (Cambridge: United Kingdom), 2001.
9. A. Welham, J. Soc. Dyers Colourists, 2000, 116, 140.
10. F. Rafii, W. Fraeankalin and C. E. Cerniglia, Appl. Environ. Microbiol., 1990, 56, 2146.
11. R. C. Kuhad, N. Sood, K. K. Tripathi, A. Singh and O. P. Ward, Adv. Appl. Microbiol., 2004, 56, 185.
12. S. R. Couto, Biotechnol. Adv., 2009, 27, 227.
13. U. Meyer, T. Cook, A. M. Hunter and R. Nuesch, FEMS symposium 12, J. (Eds.) (Academic Press: London), 1981, 371.
14. H. Zollinger, Properties of Organic Dyes and Pigments, (VCH Publishers: New York, USA), 1987, 92.
15. X. Jin, G. Liu, Z. Xu and W. Yao, Appl. Microbiol. Biotechnol., 2007, 74, 239.
16. C. M. Carliell, S. J. Barclay, N. Naidoo, C. A. Buckley, D. A. Mulholland and E. Senior, Water SA, 1995, 21, 61.
17. H. Ollgaard, L. Frost, J. Galster and O. C. Hensen, Survey of. Azocolorants on Denmark: Milgoproject 509. Danish Environmental Protection Agency, 1999.
18. A. Stolz, Appl. Microbiol. Biotechnol., 2001, 56, 69.
19. J. Bell, J. J. Plumb, C. A. Buckley and D. C. Stuckey, J. Environ. Eng., 2000, 126, 1026.
20. C. O’Neill, F. R. Hawkes, D. L. Hawkes, N. D. Lourenco, H. M. Pinheiro and W. Delee, J. Chem. Technol. Biot., 1999, 74, 1009.
21. R. J. Chudgar, Othmer encyclopedia of chemical technology, (4th ed., Vol. 3), (Wiley: New York), 1985, p. 821.
22. M. S. Reisch, Chem. Eng. News, 1996, 15, 10.
23. M. A. Brown and S. C. De Vito, Crit. Rev. Env. Sci. Tec., 1993, 23, 249.
24. J. Foussereau, B. Herve-Bazin, J. Meynadier, G. Reuter and C. Cavelier, Contact Dermatitis, 1982, 8, 73.
25. K. T. Chung and C. E. Cerniglia, Mutat. Res-Rev. Genet., 1992, 277, 201.
26. A. Ozturk and M. I. Abdullah, Sci. Total Env., 2006, 358, 137.
27. P. Rajaguru, L. Vidya, B. Baskarasethupathi, P. A. Kumar, M. Palanivel and K. Kalaiselvi, Mutat. Res., 2002, 517, 29.
28. G. A. Umbuzeiro, H. Freeman, S. H. Warren, D. P. Oliveira, Y. Terao, T. Watanabe and L. D. Claxton, Chemosphere, 2005, 60, 55.
29. S. W. Collier, J. E. Storm and R. L. Bronaugh, Toxicol. Appl. Pharm., 1993, 118, 73.
30. M. S. M. Annuar, S. Adnan, S. Vikineswary and Y. Chisti, Water Air Soil Poll., 2009, 202, 179.
31. P. Moller and H. Wallin, Mutat. Res., 2000, 462, 13.
32. M. W. McCurdy, G. D. Boardman, D. L. Michelsen and B. M. Woodby, In 46th Proc. Purdue Industrial Waste Conf. (Lewis Publishers), 1992, MI, p. 229.
33. J. H. Churchley, Water Sci. Technol., 1994, 30, 275.
34. J. Panswed and S. Wongehaisuwan, Water Sci. Technol., 1986, 18, 139.
35. H. Yoshida, S. Fukuda, A. Okamoto and T. Kataoka, Water Sci. Technol., 1991, 23, 1667.
36. O. Marmagne and C. Coste, Am. Dyest. Rep., 1996, 84, 15.
37. Metcalf and Eddy, Wastewater Engineering: Treatment and Reuse, (4th ed.) (McGraw-Hill: New York, USA), 2003.
38. T. Robinson, G. McMullan, R. Marchant and P. Nigam, Bioresour. Technol., 2001, 77, 247.
39. Y. Anjaneyulu, N. Sreedhara Chary and D. S. S. Raj, Rev. Environ. Sci. BioTechnol., 2005, 4, 245.
40. F. P. Van der Zee and S. Villaverde, Water Res., 2005, 39, 1425.
41. P. Kaushik and A. Malik, Environ. Int., 2009, 35, 127.
42. C. Park, M. Lee, B. Lee, S. W. Kim, H. A. Chase and J. Lee, Biochem. Eng. J., 2007, 36, 59.
43. M. I. Beydilli, S. G. Pavlostathis and W. C. Tincher, Water Sci. Technol., 1998, 38, 225.
44. A. Pandey, P. Singh and L. Iyengar, Int. Biodeter. Biodegr., 2007, 59, 73.
45. U. Pagga and D. Brown, Chemosphere, 1986, 15, 479.
46. G. M. Shaul, T. J. Holdsworth, C. R. Dempsey and K. A. Dostal, Chemosphere, 1991, 22, 107.
47. A. Khalid, M. Arshad and D. E. Crowley, Appl. Microbiol. Biotechnol., 2008, 79, 1053.
48. W. Hiroyuki, M. Kabuto, J. Mikuni, M. Oyadomari and H. Tanaka, Biotechnol. Prog., 2002, 18, 36.
49. K. C. Chen, J. Y. Wu, D. J. Liou and S. C. J. Huang, J. Biotechnol., 2003, 101, 57.
50. C. Novotny, K. Svobodova, P. Erbanova, T. Cajthaml, A. Kasinath and E. Lang, Soil Biol. Biochem., 2004, 36, 1545.
51. R. K. Sani and U. C. Banerjee, Enzyme Microbiol. Technol., 1999, 24, 433.
52. D. C. Kalyani, A. A. Telke, R. S. Dhanve and J. P. Jadhav, J. Hazard. Mater., 2009, 163, 735.
53. K. Wuhrmann, K. Mechsner and T. Kappeler, Eur. J. Appl. Microbiol., 1980, 9, 325.
54. E. Forgacs, T. Cserhati and G. Oros, Environ. Int., 2004, 30, 953.
55. M. R. Melgoza, A. Cruz and G. Buitron, Water Sci. Technol., 2004, 50, 149.
56. S. Sandhaya, S. Padmavathy, K. Swaminathan, Y. V. Subrahmanyam and S. N. Kaul, Process Biochem., 2005, 40, 885.
57. O. Adedayo, S. Javadpour, C. Taylor, W. A. Anderson and M. Moo-Young, World J. Microbiol. Biotechnol., 2004, 20, 545.
58. M. Asgher, H. N. Bhatti, S. A. H. Shah, A. M. Javaid and R. L. Legge, Biodegradation, 2006, 18, 311.
59. J. S. Chang, C. Chien Chou, Y. C. Yu-Chih Lin, P. J. Ping-Jei Lin, J. Y. Jin-Yen Ho and T. L. Hu, Water Res., 2001, 35, 2041.
60. P. K. Wong and P. Y. Yuen, Water Res., 1996, 30, 1736.
61. H. Horitsu, M. Takada, E. Idaka, M. Tomoyeda and T. Ogawa, Eur. J. Appl. Microbiol., 1977, 4, 217.
62. E. Idaka and Y. Ogawa, J. Soc. Dyers and Colourists, 1978, 94, 91.
63. T. Ogawa, C. Yatome, E. Idaka and H. Kamiya, J. Soc. Dyers and Colourists, 1986, 2, 12.
64. C. Yatome, T. Ogawa, H. Hishida and T. Taguchi, J. Soc. Dyers and Colourists, 1990, 106, 280.
65. K. A. Groff and B. R. Kim, J. Water Pollut. Control Fed., 1989, 63, 872.
66. L. N. Du, M. Zhao, G. Li, F. C. Xu, W. H. Chen and Y. H. Zhao, Int. Biodeter. Biodegr., 2013, 78, 108.
67. Z. W. Wang, J. S. Liang and Y. Liang, Int. Biodeter. Biodegr., 2013, 76, 41.
68. Y. L. Guo, J. H. Cheng, X. Y. Chen, Z. F. Zhang and L. F. Fan, Bioresource Technol., 2013, 144, 275.
69. J. K. Glenn and M. H. Gold, Appl. Environ. Microbiol., 1983, 45, 1741.
70. K. Enayatzamir, F. Tabandeh, B. Yakhchali, H. A. Alikhani and S. R. Couto, J. Hazard. Mater., 2009, 169, 176.
71. J. Forss and U. Welander, Int. Biodeter. Biodegr., 2009, 63, 752.
72. S. U. Jadhav, G. S. Ghodake, A. A. Telke, D. P. Tamboli and S. P. Govindwar, J. Microbiol. Biotechnol., 2008, 19, 409.
73. R. G. Saratale, G. D. Saratale, J. S. Chang and S. P. Govindwar, J. Hazard. Mater., 2009, 166, 1421.
74. C. Meehan, I. M. Banat, G. McMullan, P. Nigam, F. Smyth and R. Marchant, Environ. Int., 2000, 26, 75.
75. M. A. Martins, M. H. Cardoso, M. J. Queiroz, M. T. Ramalho and A. M. Campos, Chemosphere, 1999, 38, 2455.
76. M. Isik and D. T. Sponza, Process Biochem., 2005, 40, 1189.
77. A. M. Talarposhti, T. Donnelly and G. K. Anderson, Water Res., 2001, 35, 425.
78. S. Chinwetkitvanich, M. Tuntoolvest and T. Panswad, Water Res., 2000, 34, 2223.
79. J. R. M. Willetts, N. J. Ashbolt, R. E. Moosbrugger and M. R. Aslam, Water Sci. Technol., 2000, 42, 309.
80. K. C. A. Bromley-Challenor, J. S. Knapp, Z. Zhang, N. C. C. Gray, M. J. Hetheridge and M. R. Evans, Water Res., 2000, 34, 4410.
81. M. S. Khehra, H. S. Saini, D. K. Sharma, B. S. Chadha and S. S. Chimni, Dyes Pigments, 2005, 70, 1.
82. S. Moosvi, H. Kehaira and D. Madamwar, World J. Microbiol. Biotechnol., 2005, 21, 667.
83. S. Padmavathy, S. Sandhya, K. Swaminathan, Y. V. Subrahmanyam and S. N. Kaul, J. Environ. Sci.-China, 2003, 15, 628.
84. I. K. Kapdan, F. Kargi, G. McMullan and R. Marchant, Biotechnol. Lett., 2000, 22, 1179.
85. P. Nigam, G. McMullan, I. M. Banat and R. Merchant, Biotechnol. Lett., 1996, 18, 117.
86. K. C. Chen, W. T. Huang, J. Y. Wu and J. Y. Houng, J. Ind. Microbiol. Biot., 1999, 23, 686.
87. J. S. Chang, C. Chou and S. Y. Chen, Water Sci. Technol., 2001, 43, 261.
88. J. Yu, X. Wang and P. L. Yue, Water Res., 2001, 35, 3579.
89. W. Haug, A. Schmidt, B. Nortemann, D. C. Hempel, A. Stolz and H. J. Knackmuss, Appl. Environ. Microbiol., 1991, 57, 3144.
90. C.V. Nachiyar and G. S. Rajkumar, World J. Microbiol. Biotechnol., 2003, 19, 609.
91. T. Zimmermann, H. G. Kulla and T. Leisinger, Eur. J. Biochem., 1982, 129, 197.
92. H. G. Kulla, F. Klausener, O. Meyer, B. Ludeke and T. Leisinger, Arch. Microbiol., 1983, 135, 1.
93. M. F. Coughlin, B. K. Kinkle and P. L. Bishop, J. Ind. Microbiol. Biotechnol., 1999, 23, 341.
94. W. Sugiura, T. Miyashita, T. Yokoyama and M. Arai, J. Biosci. Bioeng., 1999, 88, 577.
95. D. A. Oxspring, G. McMullan, W.F. Smyth and R. Marchant, Biotechnol. Lett., 1996, 18, 527.
96. N. Tan, F. X. Prenafeta-Boldu, J. L. Opsteeg, G. Lettinga and J. A. Field, Appl. Microbiol. Biotechnol., 1999, 51, 865.
97. M. Kudlich, P. Bishop, H. J. Knackmuss and A. Stolz, Appl. Microbiol. Biotechnol., 1996, 46, 597.
98. H. J. Knackmuss, J. Biotechnol., 1996, 51, 287.
99. M. S. Khehra, H. S. Saini, D. K. Sharma, B. P. Chadha and S. S. Chimni, Dyes Pigments, 2005, 67, 55.
100. H. Wang, X. W. Zheng, J. Q. Su, Y. Tian, X. J. Xiong and T. L. Zheng, J. Hazard. Mater., 2009, 171, 654.
101. K. P. Gopinath, H. A. M. Sahib, K. Muthukumar and M. Velan, Bioresource Technol., 2009, 100, 670.
102. K. Jirasripongpun, R. Nasanit, J. Niruntasook and B. Chotikasatian, Int. J. Sci. Technol., 2007, 12, 6.
103. G. Parshetti, S. Kalme, G. Saratale and S. Govindwar, Acta Chim. Slov., 2006, 53, 492.
104. C. Yatome, S. Yamada, T. Ogawa and M. Matsui, Appl. Microbiol. Biotechnol., 1993, 38, 565.
105. J. S. Chang, B. Y. Chen and Y. S. Lin, Bioresource Technol., 2004, 91, 243.
106. F. Rafii and C. E. Cerniglia, Environ. Health Persp., 1995, 103, 7.
107. R. Russ, J. Rau and A. Stolz, Appl. Environ. Microbiol., 2000, 66, 1429.
108. T. Zimmermann, F. Gasser, H. Kulla and T. Leisinger, Arch. Microbiol., 1984, 138, 37.
109. Y. Suzuki, T. Yoda, A. Ruhul and W. Sagiura, J. Biol. Chem., 2001, 246, 9059.
110. S. Blumel and A. Stolz, Appl. Microbiol. Biotechnol., 2003, 62, 186.
111. D. K. Ghosh, A. Mandal and J. Chaudhuri, FEMS Microbiol. Lett., 1992, 98, 229.
112. M. Nakanishi, C. Yatome, N. Ishida and Y. Kitade, J. Biol. Chem., 2001, 49, 46394.
113. J. Maier, A. Kandelbaner, A. Eracher, A. Cavaco-Paulo and G. M. Gubitz, Appl. Environ. Microbiol., 2004, 70, 837.
114. H. Chen, S. L. Hooper and C. E. Cerniglia, Microbiology, 2005, 151, 1433.
- Author(s): Anand Sivadas, Noormohamed Abdulmalik and Narayanan Subbaraya
- Category: HTML FullText
- Published: 02 February 2017
Novel Thienyl Acrylates Bearing Different Heterocyclic Moieties and Their Larvicidal Activity
Anand Sivadasa,* Noormohamed Abdulmalika and Narayanan Subbarayab
aDepartment of Synthetic Chemistry, Orchid Chemicals and Pharmaceutical Ltd., Research and Development, Shollinganallur, Chennai, Tamilnadu, India.
bDepartment of Chemistry, Presidency College, Chennai, Tamil Nadu, India.
Published Online 16 01 2017
Several substituted thienyl acrylates have been prepared from substituted thiophene-2-carboxaldehyde, methyl acrylate and various hydroxyl heterocyclic compounds via Baylis-Hillman reaction. Structures of the synthesized thienyl acrylates were confirmed by the spectral characterization using analytical methods FT-IR, 1H NMR, 13C NMR and mass. A particular series of thienyl acrylates containing different quinoline heterocyclic moieties were examined for their Larvicidal activity against the second and fourth instar larvae of Culex quinquefasciatus and Aedes aegypti.
Heterocycles constitute one of the most important classes of organic compounds and are distributed over a great extent in nature. A range of important activities are associated with this class of substances. Most of the today’s synthetic drugs as well as many known natural drugs contain heterocyclic residues. About half of the known organic compounds have structures that incorporate at least one heterocyclic component. Heterocycles involving nitrogen, oxygen and sulfur as hetero atoms are common and more thoroughly studied than those involving other elements like phosphorus, boron, tin and silicon. Some of the natural amino acids, many essential vitamins (vitamin B series and vitamin C), alkaloids, antibiotics and dyes contain heterocyclic ring components.1-14 In addition to the predominant applications in biological sector, their potential is substantially utilized in synthetic chemistry as well as in material science. Development of new synthetic strategies for heterocycles construction became an area of great interest as a result of the phenomenal potential possessed by heterocycles.
Sulfur containing heterocycles are of immense importance biologically and industrially.15 The thiophene is the oldest known organic sulfur-containing heterocycles that possess the only one ‘S’ atom in a five membered ring. In the literature, there are many anti-cancer and anti-inflammatory agents that possess the thiophene heterocycle.16-18 Many of them are being used in the clinic and some are undergoing clinical trials.
OSI 930 (3-[(quinolin-4-ylmethyl)-amino]-thiophene-2-carboxylic acid (4-trifluoromethoxy-phenyl)-amide) is a substituted thiophene derivative which is an orally active inhibitor of two clinically validated targets: c-Kit and the vascular endothelial growth factor receptor-2 (VEGFR-2). OSI-930 is designed to target both cancer cell proliferation and blood vessel growth (angiogenesis) in selected tumors.19,20 Tiaprofenic acid and Suprofen are substituted thiophene derivatives with anti-inflammatory activity. Both the drugs are nonsteroidal anti-inflammatory drugs, prescribed mostly for the treatment of musculoskeletal pain, including back pain, osteoarthritis and rheumatoid arthritis.21,22
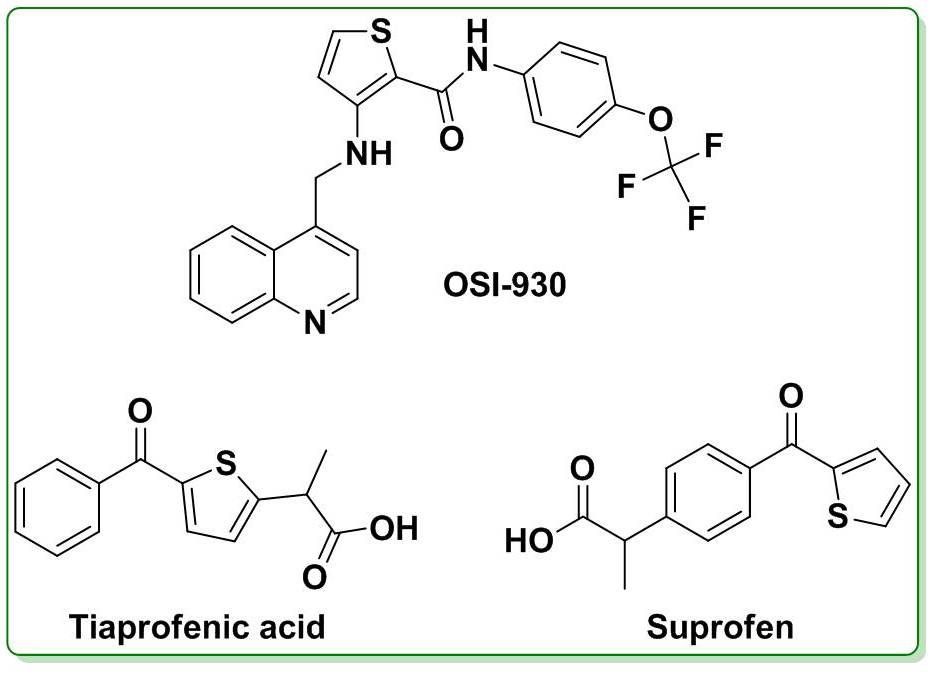
Figure 1. Chemical structures of thiophene based drugs.
From the examples listed above, it is evident that the thiophene heterocycle is an excellent scaffold for anti-cancer and anti-inflammatory drug design and variation
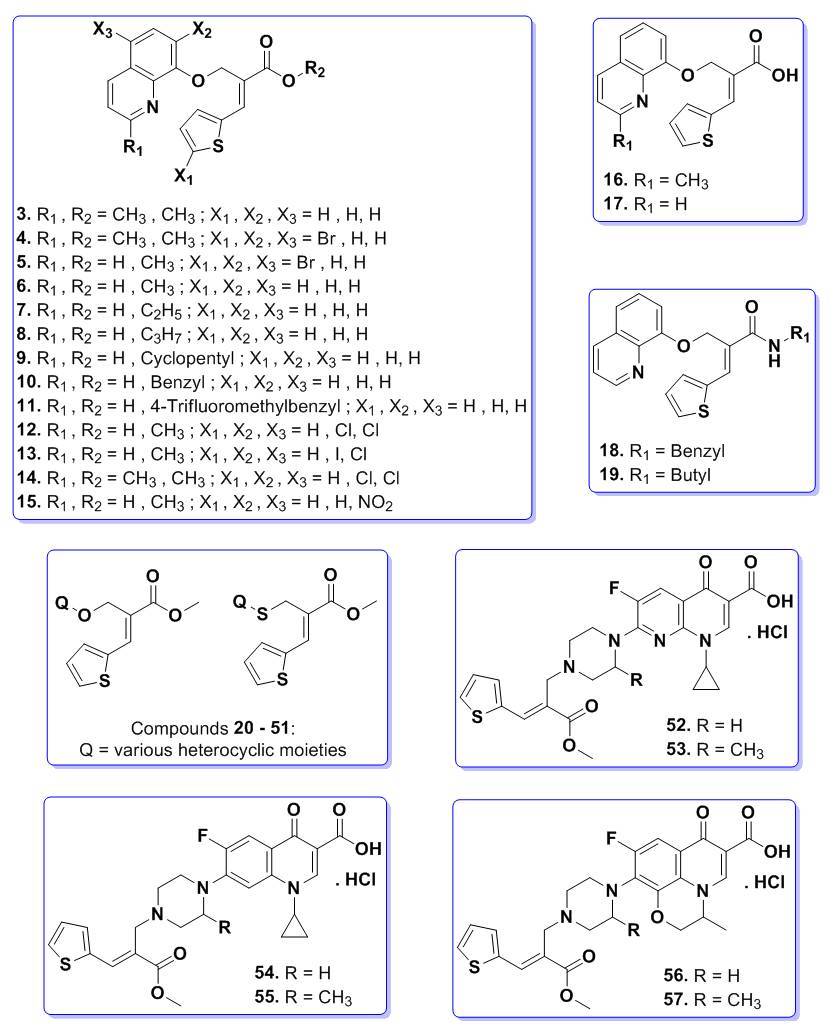
Figure 2. Different synthesized thienyl acrylate derivatives.
of substituents around this thiophene heterocycle may alter the mechanism of the activity action. Besides the substituted thiophenes, intensive research has been carried out on thiophene containing other heterocycles in the search for anti-malarial lead compounds. Recent reports have shown that a number of substituted thiophenes containing different heterocyclic moieties also possess anti-malarial activity. Some of these compounds include derivatives of quinoline containing substituted thiophenes.23
Hence, it would be rational to explore the fusion of thiophene ring with other heterocycles in an attempt to discover new thiophene scaffolds which may possess significant biological properties. With this as the aim, and in continuation of the efforts of our research group to find potent anti-malarial leads, the interest was extended to explore the synthesis of quinoline containing thiophene system and its analogues.
Also the nitrogen heterocycles present in the natural and synthetic drugs are very frequently involved as key constituents in biological processes. Particularly, Quinolines represent the major class of heterocycles, and a number of preparations have been known since the late 1800’s. The quinoline ring system occurs in various natural products, especially in alkaloids. The quinoline skeleton is often used for the design of many synthetic compounds with diverse pharmacological properties especially antimalarial, antibacterial, antifungisides, antiinflammation, antiallergic, antiproliferative, anticancer, antiparasitic and antibiocides.24-29 They also have antiseptic, antipyretic and antiperiodic properties. They are also used in dyes, rubber chemicals, and flavoring agents. Quinolines are very much used in transition-metal complex catalyst chemistry for uniform polymerization and luminescence chemistry.
The overall aim of this research was to investigate possible new antimalarial agents based on thiophene containing quinoline heterocyclic derivatives. Preliminary studies on some of these compounds carried out at the Department of Microbiology (Orchid Research Laboratories Ltd, NDD, Chennai, India) have shown that they possess moderate to potent antibacterial activity.30-32. There have been no literature reports of chemical structures of this type having any such activity. In view of the fact that some antibacterial agents also show anti-malarial activity, it was thus decided to explore the potential anti-malarial activity of compounds of this general type.
In the present study, we have synthesized a series of novel thienyl acrylate compounds with various heterocyclic moieties like quinoline, quinolinone, pyridine, pyrimidine, imidazole, thiazole, triazole, tetrazole and coumarins, which are known to posses biological activity. A basic study on the selected compounds of thiophene containing quinoline heterocylci derivatives biological activity with respect to larvicidal activity against malaria was carried out and the results are discussed.
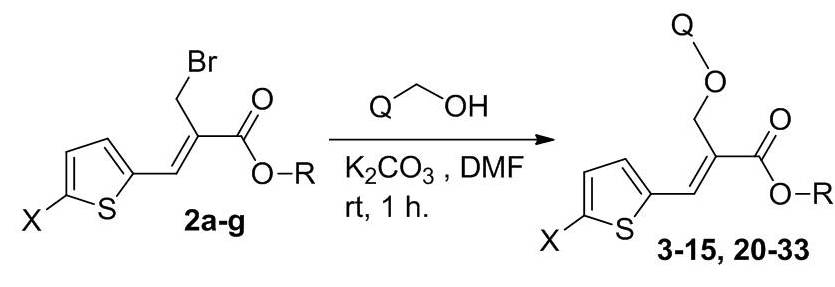
Scheme 1. Synthetic protocol of oxygen bridged thienyl acrylate compounds.
A series of oxygen bridged thienyl esters (3-15, 20-33) were synthesized by reacting the substituted bromo ester 2a-g with various hydroxyl heterocyclic compounds in the presence of K2CO3 and dry DMF (dimethylformamide) (Scheme 1). Completion of the reaction was confirmed by thin layer chromatography (TLC) and the crude products were isolated by simple precipitation in water. The resulted crude products were further purified by recrystallization method using methanol. Compounds 3-15 & 20-33 were prepared as per the Scheme 1 and their structures are depicted in Table S1 (see supporting information).31,32 The intermediate compounds 1a-g and 2a-g were prepared by following the earlier reported procedure (Scheme S1, see supporting information).31,32 The compounds 16 & 17 were prepared by treating the compounds 3 & 6 respectively with 4N NaOH solution and methanol under stirring at room temperature for 15 h. After the completion of reaction (monitored by TLC), solvent was completely distilled out under vacuum and pH of the reaction mass was adjusted to 6-7 using 10% dilute HCl (Scheme S2, see supporting information). The separated solid was stirred for 30 min., filtered and purified in methanol. The compounds 18 and 19 were prepared by condensation of compound 17 with benzyl amine/n-butyl amine in the presence of HOBt, EDC.HCl and triethyl amine in dry DMF were stirred for 10 h at room temperature (Scheme S3, see supporting information). After completion of reaction (checked TLC) water was added to the reaction mixture and stirred at room temperature for 30 min. The separated solid was filtered and purified in methanol. All the synthesized compounds were confirmed by spectral characterization using FT-IR, 1H NMR, 13C NMR and mass data.31,32
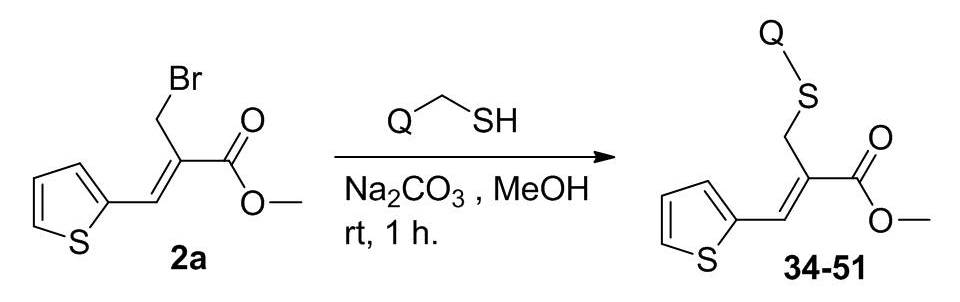
Scheme 2. Synthetic protocol of sulphur bridged thienyl acrylate compounds.
Sulphur bridged thienyl acrylate derivatives (34-51) were synthesized by reacting the bromo ester 2a with various thiol substituted heterocyclic compounds in the presence of Na2CO3 and methanol at room temperature (Scheme 2).30 Completion of the reaction was confirmed by TLC and the crude products were isolated by simple precipitation in water. The resulted crude products were further purified by recrystallization method using methanol. Compounds 34-51 were prepared as per the Scheme 2 and their structures are depicted in Table S2 (see supporting information). All the synthesized compounds were confirmed by spectral characterization using FT-IR, 1H NMR, 13C NMR and mass data.30
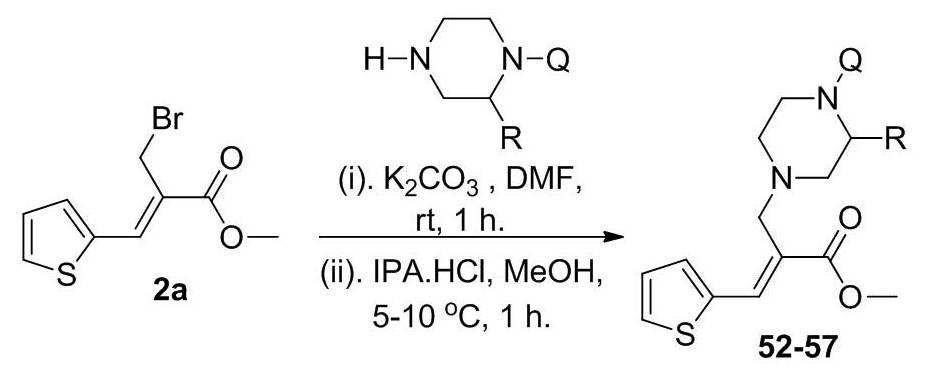
Scheme 3. Synthetic protocol of nitrogen bridged thienyl acrylate compounds.
A series of nitrogen bridged quinoline compounds (52-57) were synthesized by reacting bromo ester 2a with the piperazine substituted quinolinone compounds (I-VI) in presence of K2CO3 and DMF followed by addition of hydrochloric acid (Scheme 3). The compounds (I-VI) were prepared by the condensation of substituted piperazine and different quinolinone compounds in presence of DMSO at 80 °C for 3 h (Scheme S4, see supporting information). Completion of the reaction was confirmed by TLC and the crude products were isolated by simple precipitation in water. The resulted crude products were converted into hydrochloride salt by treating with isopropyl alcohol hydrochloride at room temperature in methanol to get pure compounds. Compounds 52-57 were prepared as per the Scheme 3 and their structures are depicted in Table S3 (see supporting information). All the synthesized compounds were confirmed by spectral characterization using FT-IR, NMR and mass data (see supporting information).
Selective compounds of thienyl acrylates containing quinoline substructures were studied for larvicidal activity against the second and fourth instar larvae of Cx. quinquefasciatus and Ae. aegypti. The results showed promising larvicidal activity against the second and fourth instar larvae of Cx. quinquefasciatus and Ae. aegypti. The toxic effect of synthesized compounds on the second and fourth instar larvae of Cx. quinquefasciatus and Ae. aegypti was tested and statistical data regarding LC50, LC90 were calculated and presented in Table 1 & 2.
Table 1. Larvicidal activity of compounds against second and fourth instar larvae of Culex quinquefasciatus.
|
Compound |
Culex quinquefasciatus |
|||
|
Second Instar Larvae |
Fourth Instar Larvae |
|||
|
LC50 |
LC90 |
LC50 |
LC90 |
|
|
3 |
35.89 |
87.65 |
70.89 |
158.56 |
|
6 |
30.50 |
70.12 |
61.25 |
110.16 |
|
9 |
35.86 |
76.89 |
98.55 |
170.25 |
|
10 |
37.25 |
76.45 |
74.12 |
144.36 |
|
11 |
49.46 |
99.25 |
76.24 |
143.56 |
|
12 |
24.21 |
49.54 |
47.88 |
95.36 |
|
13 |
25.05 |
50.22 |
49.55 |
94.26 |
|
14 |
24.56 |
49.31 |
48.88 |
96.34 |
|
15 |
28.46 |
56.65 |
55.85 |
108.18 |
|
17 |
38.42 |
76.98 |
64.56 |
148.25 |
Cx. quinquefasciatus and Ae. aegypti larvae were collected from various places with clean stagnant water. They were colonized and maintained continuously for generations in the laboratory free of exposure to pathogens, insecticides or repellents. They were maintained at 27±2°C, 75-85% RH with 14:10 L/D photoperiod cycle. The larvae were fed with dog biscuits, yeast extract in the ratio of 3:1. Water was changed everyday to avoid scum formation, which might create toxicity. Pupae were transferred from the trays to a cup containing tap water and placed in screened cages (45x45x45 cm dimension) where the adults emerged. The adult mosquitoes were reared in the glass cages of 45x45x45 cm dimension. Adults were continuously provided with 10% sucrose solution in a petridish with cotton wick. On the day of post-emergence the adult females were deprived of sucrose from 12 h and then provided with a mouse placed in resting cages overnight for blood feeding. After three days ovitrap was kept into the cages and the eggs were collected and transferred to enamel trays. They were maintained at the same condition for experiment.
Chloro quinoline and nitro quinoline substituted thienyl acrylate compounds showed very good larvicidal activity against the second instar larvae of Cx. quinquefasciatus and Ae. Aegypti compared to other quinoline compounds. The LC50 values of the tested compounds (3, 6, 9-15 and 17) against the second instar larvae were 35.89, 30.50, 35.86, 37.25, 49.46, 24.21, 24.56, 28.46, 25.05, and 38.42 ppm on Cx. quinquefasciatus (Table 1).
Table 2. Larvicidal activity of compounds against second and fourth instar larvae of Aedes aegypti.
|
Compound |
Aedes aegypti |
|||
|
Second Instar Larvae |
Fourth Instar Larvae |
|||
|
LC50 |
LC90 |
LC50 |
LC90 |
|
|
3 |
32.93 |
65.64 |
71.79 |
141.56 |
|
6 |
36.47 |
74.15 |
56.45 |
108.18 |
|
9 |
36.78 |
77.46 |
99.25 |
180.65 |
|
10 |
38.12 |
76.45 |
75.34 |
150.36 |
|
11 |
39.35 |
78.89 |
77.36 |
154.56 |
|
12 |
20.22 |
41.46 |
38.76 |
96.34 |
|
13 |
25.85 |
50.22 |
50.65 |
104.36 |
|
14 |
23.44 |
47.36 |
44.64 |
95.36 |
|
15 |
28.62 |
57.54 |
52.36 |
104.26 |
|
17 |
49.46 |
99.25 |
68.65 |
138.65 |
In Ae. aegypti the LC50 values of the tested compounds (3, 6, 9-15 and 17) against the second instar larvae were 32.93, 36.47, 36.78, 38.12, 39.35, 20.22, 23.44, 28.46, 25.85 and 49.46 ppm (Table 2). Highest larvicidal effect was observed in compound 12 LC50 (24.21 & 20.22) followed by compound 14 (24.56 & 23.44), compound 13 (25.05 & 25.85) and compound 15 (28.46 & 28.62) against the second instar larvae of Cx. quinquefasciatus and Ae. Aegypti. Among the ten compounds tested in this study, compound 12 was the most active and showed dose dependent mortality on mosquito larvae.
Conclusions
All the time there is a substantial demand for new and efficient processes in synthesizing novel heterocycles. The main focus of this research was to synthesize a new thienyl acrylate derivatives bearing different heterocycles and evaluation of anti-malarial activity of the synthesized derivatives. Structure of synthesized compounds were confirmed by the spectral characterization using analytical data such as FT-IR, 1H NMR, 13C NMR and mass spectra. The heterocyclic compounds with thienyl and quinoline type linkages have shown good larvicidal activity against the second and fourth instar larvae of Culex quinquefasciatus and Aedes aegypti.
Acknowledgements
Authors are thankful to the management of Orchid Chemicals and Pharmaceutical Ltd for the excellent support to perform this research project. We are also thankful for the kind support from the Staff of Orchid Chemicals and Pharmaceuticals Ltd in recording the spectral data and studying the biological activity of the synthesized compounds.
Notes and References
* Corresponding Author Details: Anand Sivadas, Department of Synthetic Chemistry, Orchid Chemicals and Pharmaceutical Ltd., Research and Development, Shollinganallur, Chennai, Tamilnadu, India.
E-mail id.: This email address is being protected from spambots. You need JavaScript enabled to view it.
† Supporting Information (SI) available: [Experimental Procedures, Spectral data].
1. Y. W. Chin, M. J. Balunas, H. B. Chai and A.D. Kinghorn, AAPS J., 2006, 8, 239.
2. F. E. Koehn and G. T. Carter, Nat. Rev. Drug Discov., 2005, 4, 206.
3. G. A. Cordell, M. L. Quinn-Beattie and N. R. Farnsworth, Phytother. Res., 2001, 15, 183.
4. E. H. Hughes and J. V. Shanks, Metab. Eng., 2002, 4, 41.
5. S. R. Norman, Drug Development Res., 2008, 69, 15.
6. R. Dahm, Human Genetics, 2008, 122, 565.
7. J. D. Watson and F. H. Crick, Nature, 1953, 171, 737.
8. National Academy of Sciences. Institute of Medicine. Food and Nutrition Board., Chapter 9 - Vitamin B . Dietary Reference Intakes for Thiamin, Riboflavin, Niacin, Vitamin B, Folate, Vitamin B, Pantothenic Acid, Biotin and Choline, (National Academy Press: Washington, D. C.), 1998, p. 346.
9. M. B. Davies, J. Austin and D. A. Partridge, Vitamin C: Its Chemistry and Biochemistry, (The Royal Society of Chemistry), 1991, p. 48.
10. H. M. Evans, O. H. Emerson and G. A. Emerson, J. Biol. Chem., 1936, 113, 319.
11. P. Furst and P. Stehle, J. Nutrition, 2004, 134, 1558S.
12. M. F. Perutz, Brookhaven symposia in Biol., 1960, 13, 165.
13. P. W. Brian,. Proceedings of the Royal Society of London. Series B, Biological Sci., 1978, 200, 231.
14. D. Rajiv, S. Suman, S. K. Sonwane and S. K. Srivastava, Adv. Biological Res., 2011, 5, 120.
15. M. G. Valverde and T. Torroba, Molecules, 2005, 10, 318.
16. B. C. Widemann, F. M. Balis, K. S. Godwin, C. McCully and P. C. Adamson, Cancer Chemo. Pharma., 1999, 44, 439.
17. https://en.wikipedia.org/wiki/Lornoxicam
18. https://en.wikipedia.org/wiki/Tenoxicam
19. A. J. Garton, A. P. Crew, M. Franklin, A. R. Cooke, G. M. Wynne, L. Castaldo, J. Kahler, S. L. Winski, A. Franks, E. N. Brown, M. A. Bittner, J. F. Keily, P. Briner, C. Hidden, M. C. Srebernak, C. Pirrit, M. O'Connor, A. Chan, B. Vulevic, D. Henninger, K. Hart, R. Sennello, A. H. Li, T. Zhang, F. Richardson, D. L. Emerson, A. L. Castelhano, L. D. Arnold and N. W. Gibson, Cancer Res., 2006, 66, 1015.
20. T. A. Yap, H. T. Arkenau, D. R. Camidge, S. George, N. J. Serkova, S. J. Gwyther, J. L. Spratlin, R. Lal, J. Spicer, N. M. Desouza, M. O. Leach, J. Chick, S. Poondru, R. Boinpally, R. Gedrich, K. Brock, A. Stephens, S. G. Eckhardt, S. B. Kaye, G. Demetri and M. Scurr, Clin. Cancer Res., 2013, 19, 909.
21. http://www.drugbank.ca/drugs/DB01600
22. http://www.drugbank.ca/drugs/DB00870
23. I. M. Opsenica, T. Z. Verbić, M. Tot, R. J. Sciotti, B. S. Pybus, O. Djurković-Djaković, K. Slavić and B. A. Šolaja. Bioorg. Med. Chem., 2015, 23, 2176.
24. H. Cairns, D. Cox, K. J. Gould, A. H. Ingal and J. Suschitzky, J. Med. Chem., 1985, 28, 1832.
25. R. Jain, S. Jain, R. C. Gupta, N. Anand, G. P. Dutta and S. K. Puri, Indian. J. chem., 1994, 33B, 251.
26. A. Mohammed, N. Abdel-Hamid, F. Maher and A. Farghaly, Czech. Chem. Commun., 1992, 57, 1547.
27. M. Croisy-Delcey, A. Coroisy, D. Carrez, C. Huel, A. Chiaroni, P. Ducrot, E. Bisabni, L. Jin and G. Leclercq, Bioorg. Med. Chem., 2000, 8, 2629.
28. A. Dlugosz and D. Dus, Farmaco, 1996, 51, 367.
29. A. H. Abadi and R. Brun, Arzneimforsch. Drugs. Res, 2003, 53, 655.
30. A. Sivadas, M. Paul-Satyaseela, T. Bharani, U. S. Kumar and N. Subbaraya, Int. J. Pharm. Sci. Res., 2011, 2, 27.
31. A. Sivadas, M. Paul-Satyaseela, T. Bharani, U. S. Kumar and N. Subbaraya, Int. J. Pharm. Sci. Res., 2011, 2, 893.
32. A. Sivadas and N. Subbaraya, Int. J. Pharm. Sci. Res., 2011, 2, 1007.
- Author(s): Derin Mary Thomas and A. S. Arun Prasad
- Category: HTML FullText
- Published: 02 January 2017
Direct Orange 26 - Azo Dye: Decolorization and Degradation by Bacillus mojavensis ABR
Derin Mary Thomasa and A. S. Arun Prasada,*
aDivision of Environmental Biotechnology, School of Biosciences and Technology, VIT University, Vellore, India.
Published Online 02 01 2017
Abstract:
The potential of the bacterial strain surviving in the harsh conditions of the textile effluents was tested to decolorize and degrade the structurally complex azo dye. The bacterium Bacillus mojavensis strain ABR isolated from the textile effluent was evaluated in decolorizing the azo dye Direct Orange 26 (DO-6). 100 mgl-1 of DO-26 was decolorized with 95% efficiency within 6 hrs at pH 7 and 37°C with 5% NaCl under static conditions in decolorizing medium. Decrease in absorbance at 493 nm (λmax) was periodically evaluated using UV-Vis spectrophotometer to check the decolorization. HPLC showed the formation of metabolites at different retention times indicating degradation of DO-26 which was further confirmed by LC-MS. The less toxic nature of the DO-26 degraded metabolites was confirmed by the phytotoxicity test on seeds of Vigna mungo, Sorghum bicolor and Vigna radiata.
INTRODUCTION
The natural environment we live in is composed of atmosphere, earth, water and space. The composition and complex nature of this stable environment was altered as a result of various human activities such as globalization and industrialization resulting in the setting up of different industries viz. textile industry, paper industry, food industry etc. Among these industries the textile industry is one of the largest and oldest sectors. The textile industry has major impact on nation’s economy as well as on the environmental quality of life.1 The textile industry uses a wide variety of chemical products which contain dispersants, alkalis, organic surfactants, solvents, humectants, acids, salts and residual dyes.2 The textile industry processes consume large amounts of freshwater and release equal quantity of wastewater, making it one of the main sources of severe pollution worldwide.3 The textile wastewaters is rated as the most polluted of all industries and are characterized by fluctuations in many parameters such as pH, temperature, chemical oxygen demand (COD), biological oxygen demand (BOD), salinity and colour.4,5 The wastewaters contain detergents, metals, surfactants, suspended and dissolved solids, dispersants, levelling agents, toxic organics (phenols), chlorinated compounds (AOX) and formaldehyde.6 The most common units of textile processing include desizing, bleaching, mercerising and dyeing processes. The dyeing processes form an integral part of textile industry which uses 1.3 million tons of dyes and dye precursors.7 About 10,000 different synthetic dyes are used in textile dyeing industries with over 7×10⁵ tons of these dyes produced annually worldwide.8,9 Nearly 10-15% of these dyes does not bind to fabric and is released into the environment during the dyeing process.10-12 Since these dyes are harmful their discharge poses serious environmental problems.13 The important classes of synthetic dyes include anthraquinone, triaryl methane and azo dyes. Azo dyes are the largest group of organic synthetic dyes extensively used in paper making, cosmetic and textile industries.14,15 The major group of dyes mostly used in industry are azo dyes.16-18 These are characterized by the presence of one or more azo groups (-N=N-). As per estimates nearly 2,000 different azo dyes are used to dye various materials such as textiles, leather, plastics, cosmetics and food. A number of physicochemical methods are available for the remediation of dye wastewaters such as adsorption, chemical oxidation, precipitation, coagulation, filtration, electrolysis and photodegradation. The major disadvantages of these techniques are high cost, low efficiency, limited versatility, interference by other wastewater constituents and secondary waste generation.19,20 Remediation using biological methods is generally considered environmentally friendly as it leads to complete mineralization of organic pollutants at low cost.21 Use of microorganisms offers considerable advantages in being relatively inexpensive, low running cost and the end products of mineralization are not toxic.22 Bacterial decolorization of dyes has gained importance in recent times and is found to be normally faster compared to fungal decolorization.7,23-25 The current study aims to evaluate the ability of the strain Bacillus mojavensis ABR in decolorizing and degrading the azo dye Direct Orange 26 (DO-26). The strain ABR was assessed for its potential to decolorize DO-26 at different pH, temperature, salinity and increasing dye concentration under static conditions. DO-26 degraded products were analysed by High Pressure Liquid Chromatography (HPLC) and Liquid Chromatography Mass Spectrometer (LC-MS). The phytotoxicity study on the seeds of Vigna radiata, Sorghum bicolor and Vigna mungo revealed the less toxic nature of the metabolites.
MATERIALS AND METHODS
Chemicals
The Azo dye Direct Orange 26 (DO-26) with maximum absorption at 493 nm (λmax) was obtained from a local textile mill in Tamil Nadu, India in pure form. HPLC- grade methanol was purchased from Sigma. Dye stock solution was prepared by dissolving 1000 mg L-1 of DO-26 in double distilled water and purified by membrane filtration (0.22 µm). The structure of the dye is shown in Fig. 1.
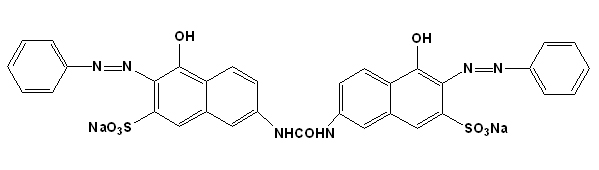
Figure 1. Chemical structure of the Azo dye Direct Orange 26.
Analytical Methods
UV-Visible spectrophotometer (Hitachi U-2800) was used to analyse decolorization. Biodegradation was assayed by HPLC (Waters, Model No.501) and HPLC-MS (Thermo Finnigan Surveyor-Thermo LCQ Deca XP MAX).
Isolation, Screening and Identification of Dye decolorizing Bacteria from Textile Effluent
The collected textile effluent from Coimbatore was serially diluted from 10-1 to 10-7and plated on Luria Bertani (LB) Agar plates and were incubated at 37°C for 24h. Distinct colonies were separated and repeatedly streaked on LB Agar plates to obtain pure colonies. Initial screening for DO-26 decolorization was carried out in 50 ml of decolorizing media containing gl-1 Peptone, 10, Meat Extract, 10, NaCl, 5 under static conditions with 5 mg L-1 of DO-26. 5 mg L-1 of DO-26 was added to the overnight grown isolates and incubated under static conditions to check for decolorization. The isolate which exhibited highest potential in decolorizing DO-26 was chosen and identified by molecular method using 16S rRNA gene sequencing.26 The obtained gene sequence was evaluated at NCBI server (http://www.ncbi.nlm.nih.gov) using BLAST (blastn) tool and the homology was analysed using CLUSTAL W.27 The sequences were aligned by the neighbour-joining method using Kimura-2-parameter distances and phylogenetic tree was constructed in MEGA version 5 package.28 The nucleotide sequence data obtained was deposited in the GenBank under accession number HF568798.
Dye decolorization study
A loopfull of the potential isolate (Bacillus mojavensis ABR) was inoculated in LB broth and precultured with shaking at 130 rpm for overnight.29 7% (v/v) of the pregrown inoculum of the potential isolate was used to inoculate 100 ml of decolorizing medium in 250 ml Erlenmeyer flasks containing 100 mg l-1 of Direct Orange 26 dye. The process of decolorization was carried out by incubating the set up at pH 7 and 37°C under static conditions. At regular intervals (0hr, 2hr, 4h and 6hr) an aliquot (3ml) of sample was withdrawn and centrifuged at 8,000 × g for 15 min. The supernatant was separated and assayed for decolorization by measuring the absorbance at 493 nm (λmax). Control (uninoculated medium) was always included. The percentage of reduction in dye concentration was analysed by the formula: (%) = Ci-Cr/Ci×100%, where Ci and Cr were initial and residual dye concentrations, respectively. All experiments were carried out in triplicate.
Effect of external factors on DO-26 decolorization
The effect of external factors on DO-26 decolorization by B. mojavensis ABR was assayed. The effect of various pH (6, 7, 8 and 9), temperatures (32, 37, 40 and 45°C) and salinity levels (2, 5, 7 and 10% NaCl) was analysed in decolorizing medium in 250 ml Erlenmeyer flasks containing 100 mg l-1 of Direct Orange 26 dye under static conditions.
Degradation Analysis by HPLC and LCMS
The analysis of degraded metabolites of Direct Orange 26 (DO-26) by B. mojavensis ABR was carried out by High Pressure Liquid Chromatography (HPLC) and Liquid Chromatography Mass Spectrometer (LC-MS). The culture broth (100 ml) was withdrawn at initial and final hours (before and after decolorization), centrifuged at 10, 000g for 15 min and metabolites were extracted from the supernatant using equal volumes of ethyl acetate. The extracts were dried and evaporated to dryness in rotary evaporator. Degraded metabolites were analysed by HPLC on reverse phase C18 column (symmetry, 4.6×150 mm) equipped with dual λ UV-Vis detector. The collected samples at different time (0h and 6h) were dried and dissolved in 2 mL HPLC grade methanol. The mobile phase used was methanol/water (50:50, v/v) with a flow rate of 0.8 mL min-1 for 10 min and UV detector set 493 nm. To analyze the dye degradation, the HPLC-MS (Thermo Finnigan Surveyor - Thermo LCQ Deca XP MAX) with Xcalibur software was used. 10 µL of the prepared solutions containing degraded dye moieties were injected into the LC/MS and the mass spectra of the samples were then determined. The composition of the mobile phase was a mixed solution of water and methanol (50:50) and its flow rate was 0.2 mL/min for 60 min run time. The stationary phase was the C18 reverse phase column (BDS HYPERSIL C18, 4.6 × 250 mm, 5.0 µm). The mass spectra were obtained using Electro Sprat Ionization (ESI) under the flow of Helium gas at 1mL/min approximately and the fragment voltage was 16 (V).
Phytotoxicity Study
The seeds of V. radiata, S. bicolor and V. mungo were used for phytotoxicity study against 100 ppm concentration of DO-26 dye and its degraded metabolites. The seeds of respective plants were grown with fixed volume of azo dye (DO-26), degraded metabolites and distilled water as control. The difference in root in shoot lengths of these seeds was measured after a period of seven days.
Statistical Analysis
All the experiments were carried out in triplicate and the data was analysed using ANOVA with Tukey-Kramer multiple comparison test. The results were expressed as the mean ± SD (standard deviation).
Figure 2. Bacillus mojavensis strain ABR pure culture on Luria Bertani Agar.
RESULTS AND DISCUSSION
Isolation, Screening and Identification of DO-26 decolorizing bacteria from Textile Effluent
Out of 15 bacterial isolates from the textile effluent sample from Coimbatore, the potential bacterial strain Bacillus mojavensis ABR (Fig. 2) was chosen based on its ability to decolorize Direct Orange 26 (DO-26) in decolorizing medium. 100 mg L-1 of DO-26 azo dye was decolorized by strain ABR with 95% rate at 37 °C, pH 7 and in the presence of 7% NaCl under static conditions in 6 h. Based on 16S rRNA sequence comparison the active isolate was identified as Bacillus mojavensis strain ABR (1341 bp). The homology study indicated that the strain ABR had 98% nucleotide identity with Bacillus mojavensis strain LZ013 (JQ073762). The relationship of strain ABR to other Bacillus species is shown in a phylogenetic tree depicted in Fig. 3.
Decolorization of DO-26 by Bacillus mojavensis strain ABR
The decolorization of DO 26 azo dye by Bacillus mojavensis was shown in Fig. 4.
Figure 3. Phylogenetic tree of Bacillus mojavensis strain ABR.
Figure 4. Erlenmeyer flasks showing decolorization of DO-26 by Bacillus mojavensis strain ABR a.) Control b.) DO-26 decolorized ( 6 hrs) c.) DO-26 (0 hrs).
The result of azo dye (DO-26) decolorization by Bacillus mojavensis strain ABR by UV-Vis spectrophotometer is depicted in Fig. 5. The initial dye peak at 493 nm was found to decrease significantly with decolorization at the end of 6 h. Bacillus mojavensis strain ABR decolorized DO-26 at a concentration of 100 mg L-1 by 95% efficiency within a time span of 6 h at 37°C and pH 7 under static conditions.
Figure 5. UV- Scan of supernatant extracted at different time intervals during DO-26 decolorization. Samples withdrawn at 0hr, 4hr and 6hr (A: 0hr spectra; B: 4h spectra; C: 6hr spectra).
Effect of external parameters on DO-26 decolorization
Environmental factors are known to play a key role in the process of decolorization of dyes by microorganisms.30 Bacillus mojavensis ABR decolorized DO-26 dye with 95% efficiency at pH 7 under static conditions (Fig. 6a). Decolorization rates of about 26, 60 and 41% were noticed at pH 6, 8 and 9 respectively. The effect of temperature on DO-26 decolorization by ABR is represented in Fig. 6b. The optimal temperature for DO-26 decolorization was 37°C. Increase in temperature resulted in gradual decrease in decolorization rate exhibiting 51% and 33% at 40°C and 45°C. Decolorization rate was found to be 40% at 32°C. Similar results were observed with respect to temperature in Bacillus cohnii MTCC 3616 and Deinococcus radiodurans R1.31,32 Decreased rate of decolorization at high temperatures could be due to deactivation of enzymes.33,34 DO-26 decolorization in the presence of varying salt concentrations is depicted in the Fig. 6c. The rate of DO-26 decolorization increased with NaCl concentration. Optimal decolorization (95%) of DO-26 by B. mojavensis ABR was observed at 5% NaCl concentration (Fig. 4c). At 2% and 7% NaCl concentrations the rates of decolorization was 43% and 30% respectively. Lowest rate of decolorization of about 18% was noticed at higher (10%) NaCl concentration. The reason for decreased decolorization rate at higher salt concentrations is due to stress as bacterial cells cannot tolerate high salt concentrations.35 Similar inhibition activity at high salt levels was observed in Bacillus sp. YZU1 decolorizing Reactive Black 536 and in Bacillus cohnii MTCC 3616.31
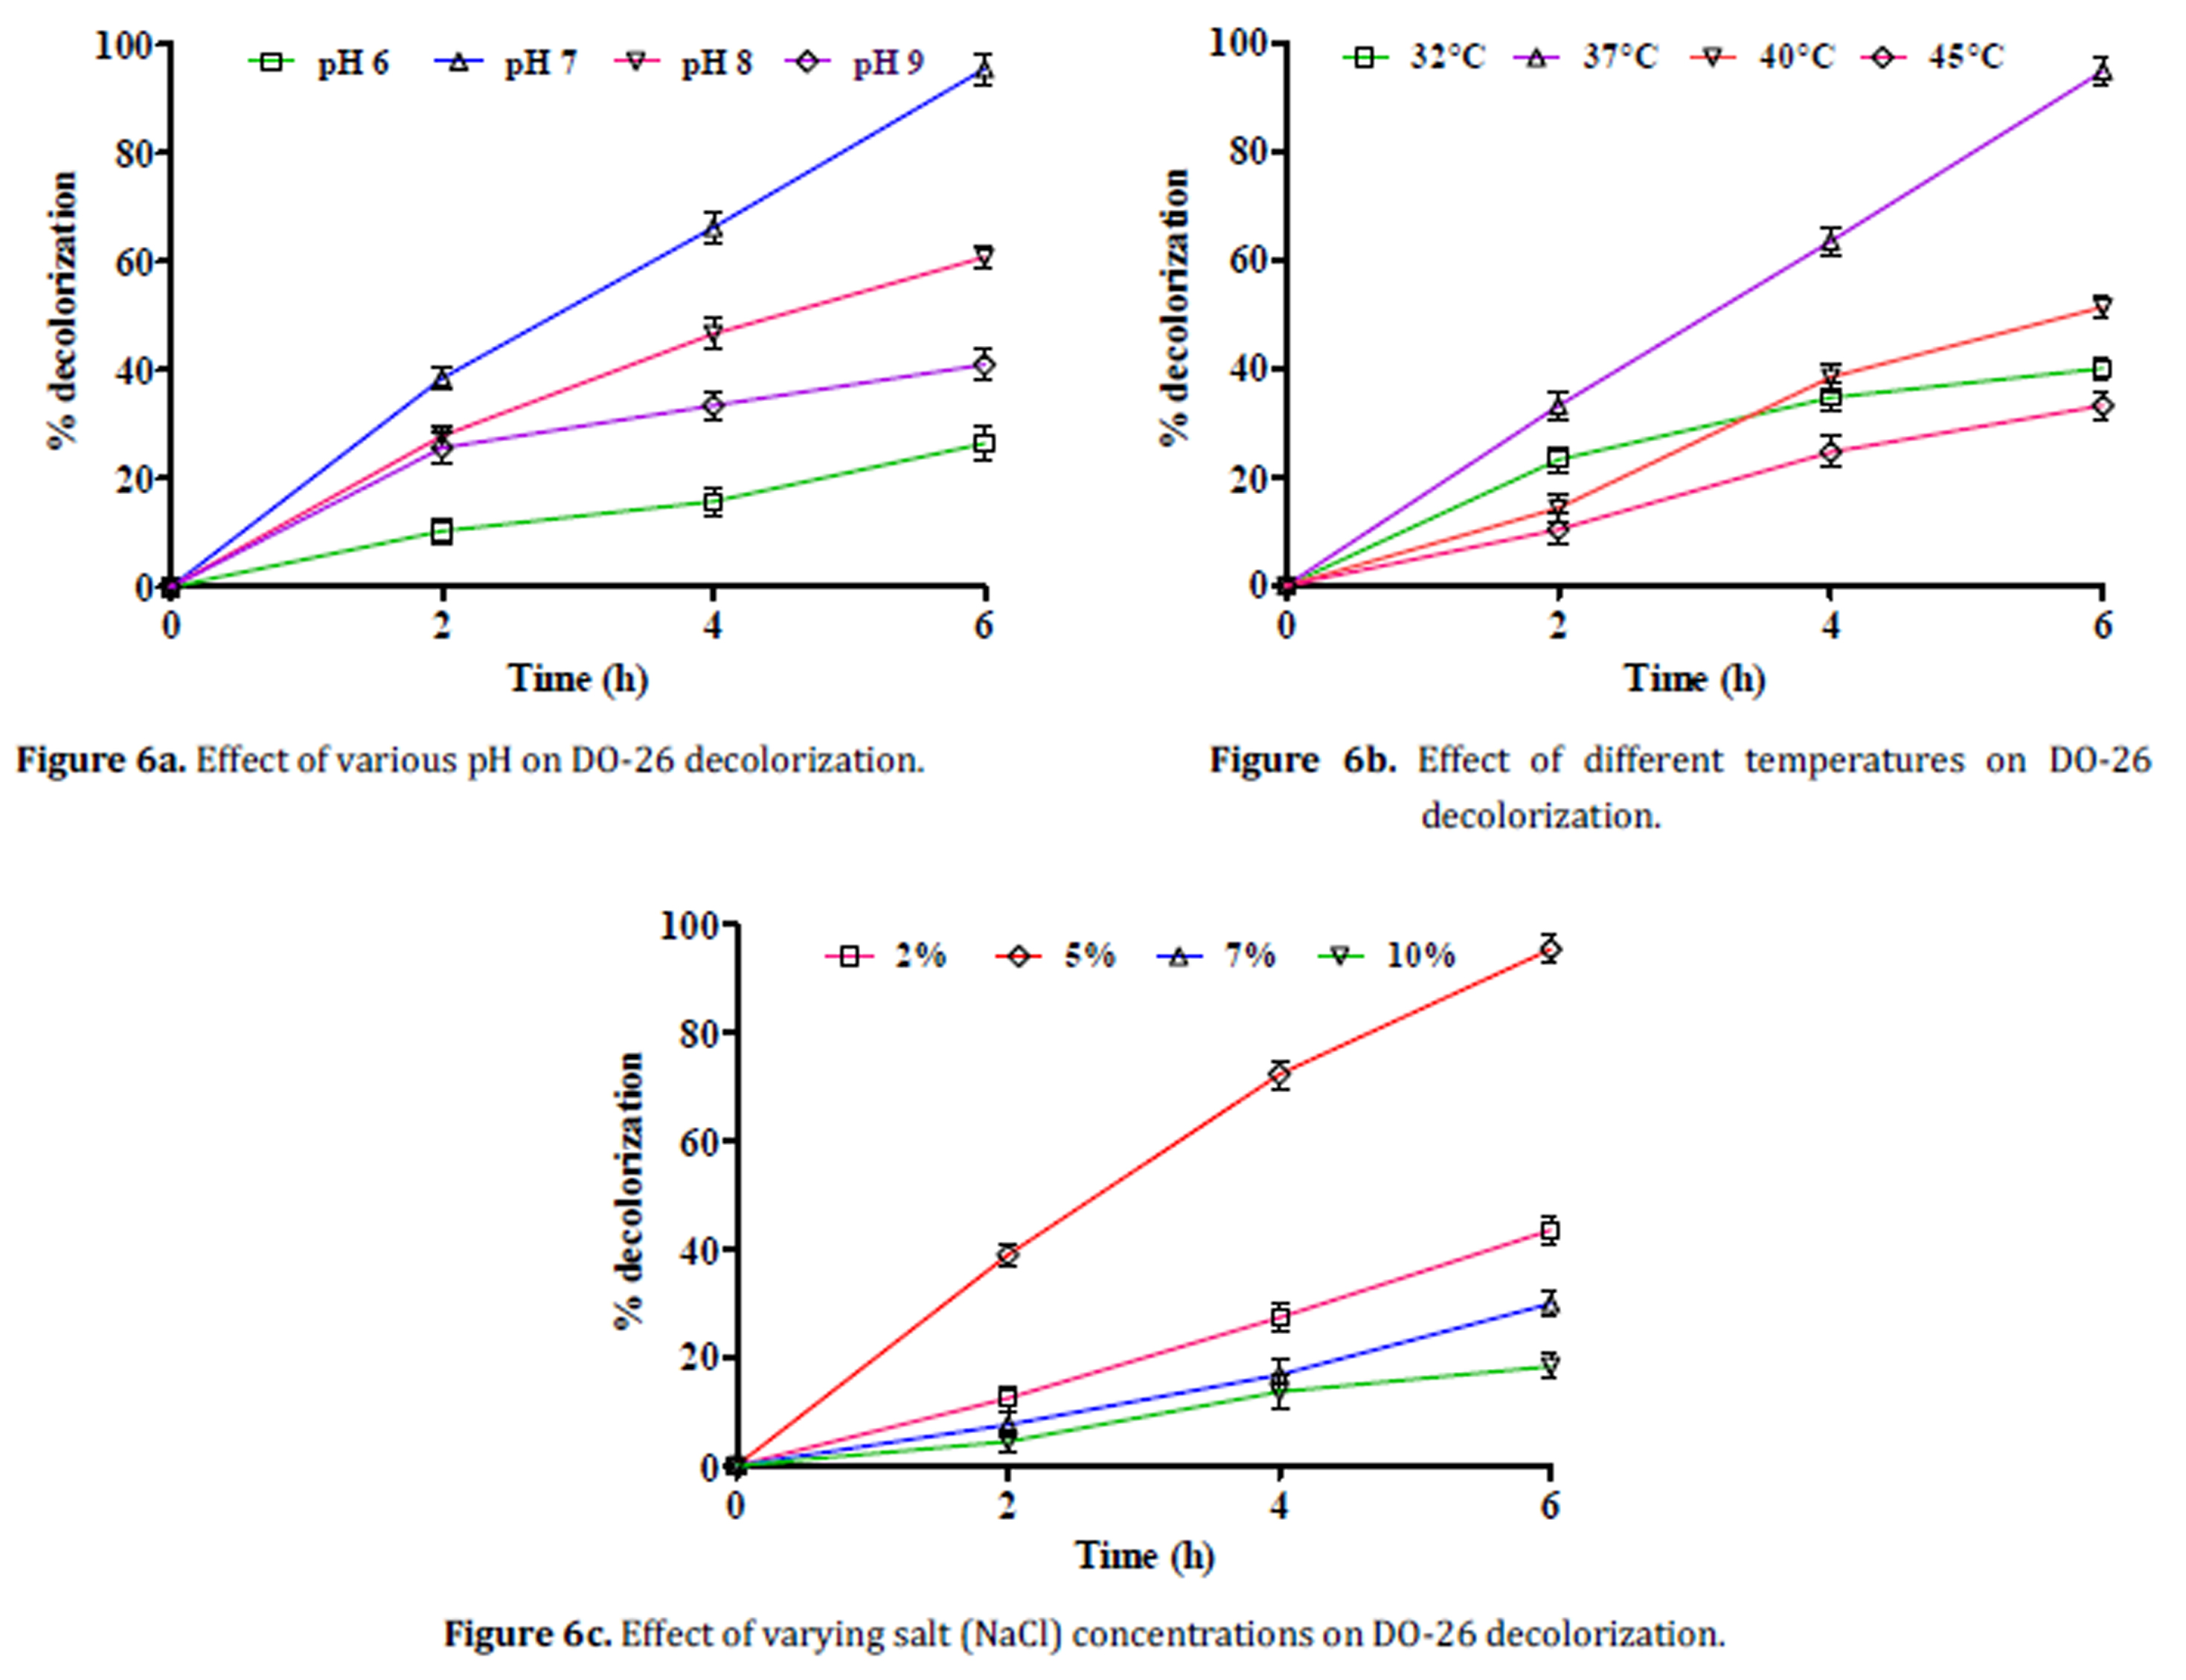
DO-26 biodegradation analysis by HPLC and LCMS
The result of HPLC analysis of azo dye Direct Orange 26 (DO-26) is depicted in Fig. 7a. The dye (DO-26) eluted as a single peak at a retention time of 2.98 min. The single peak of the dye represents its purity.
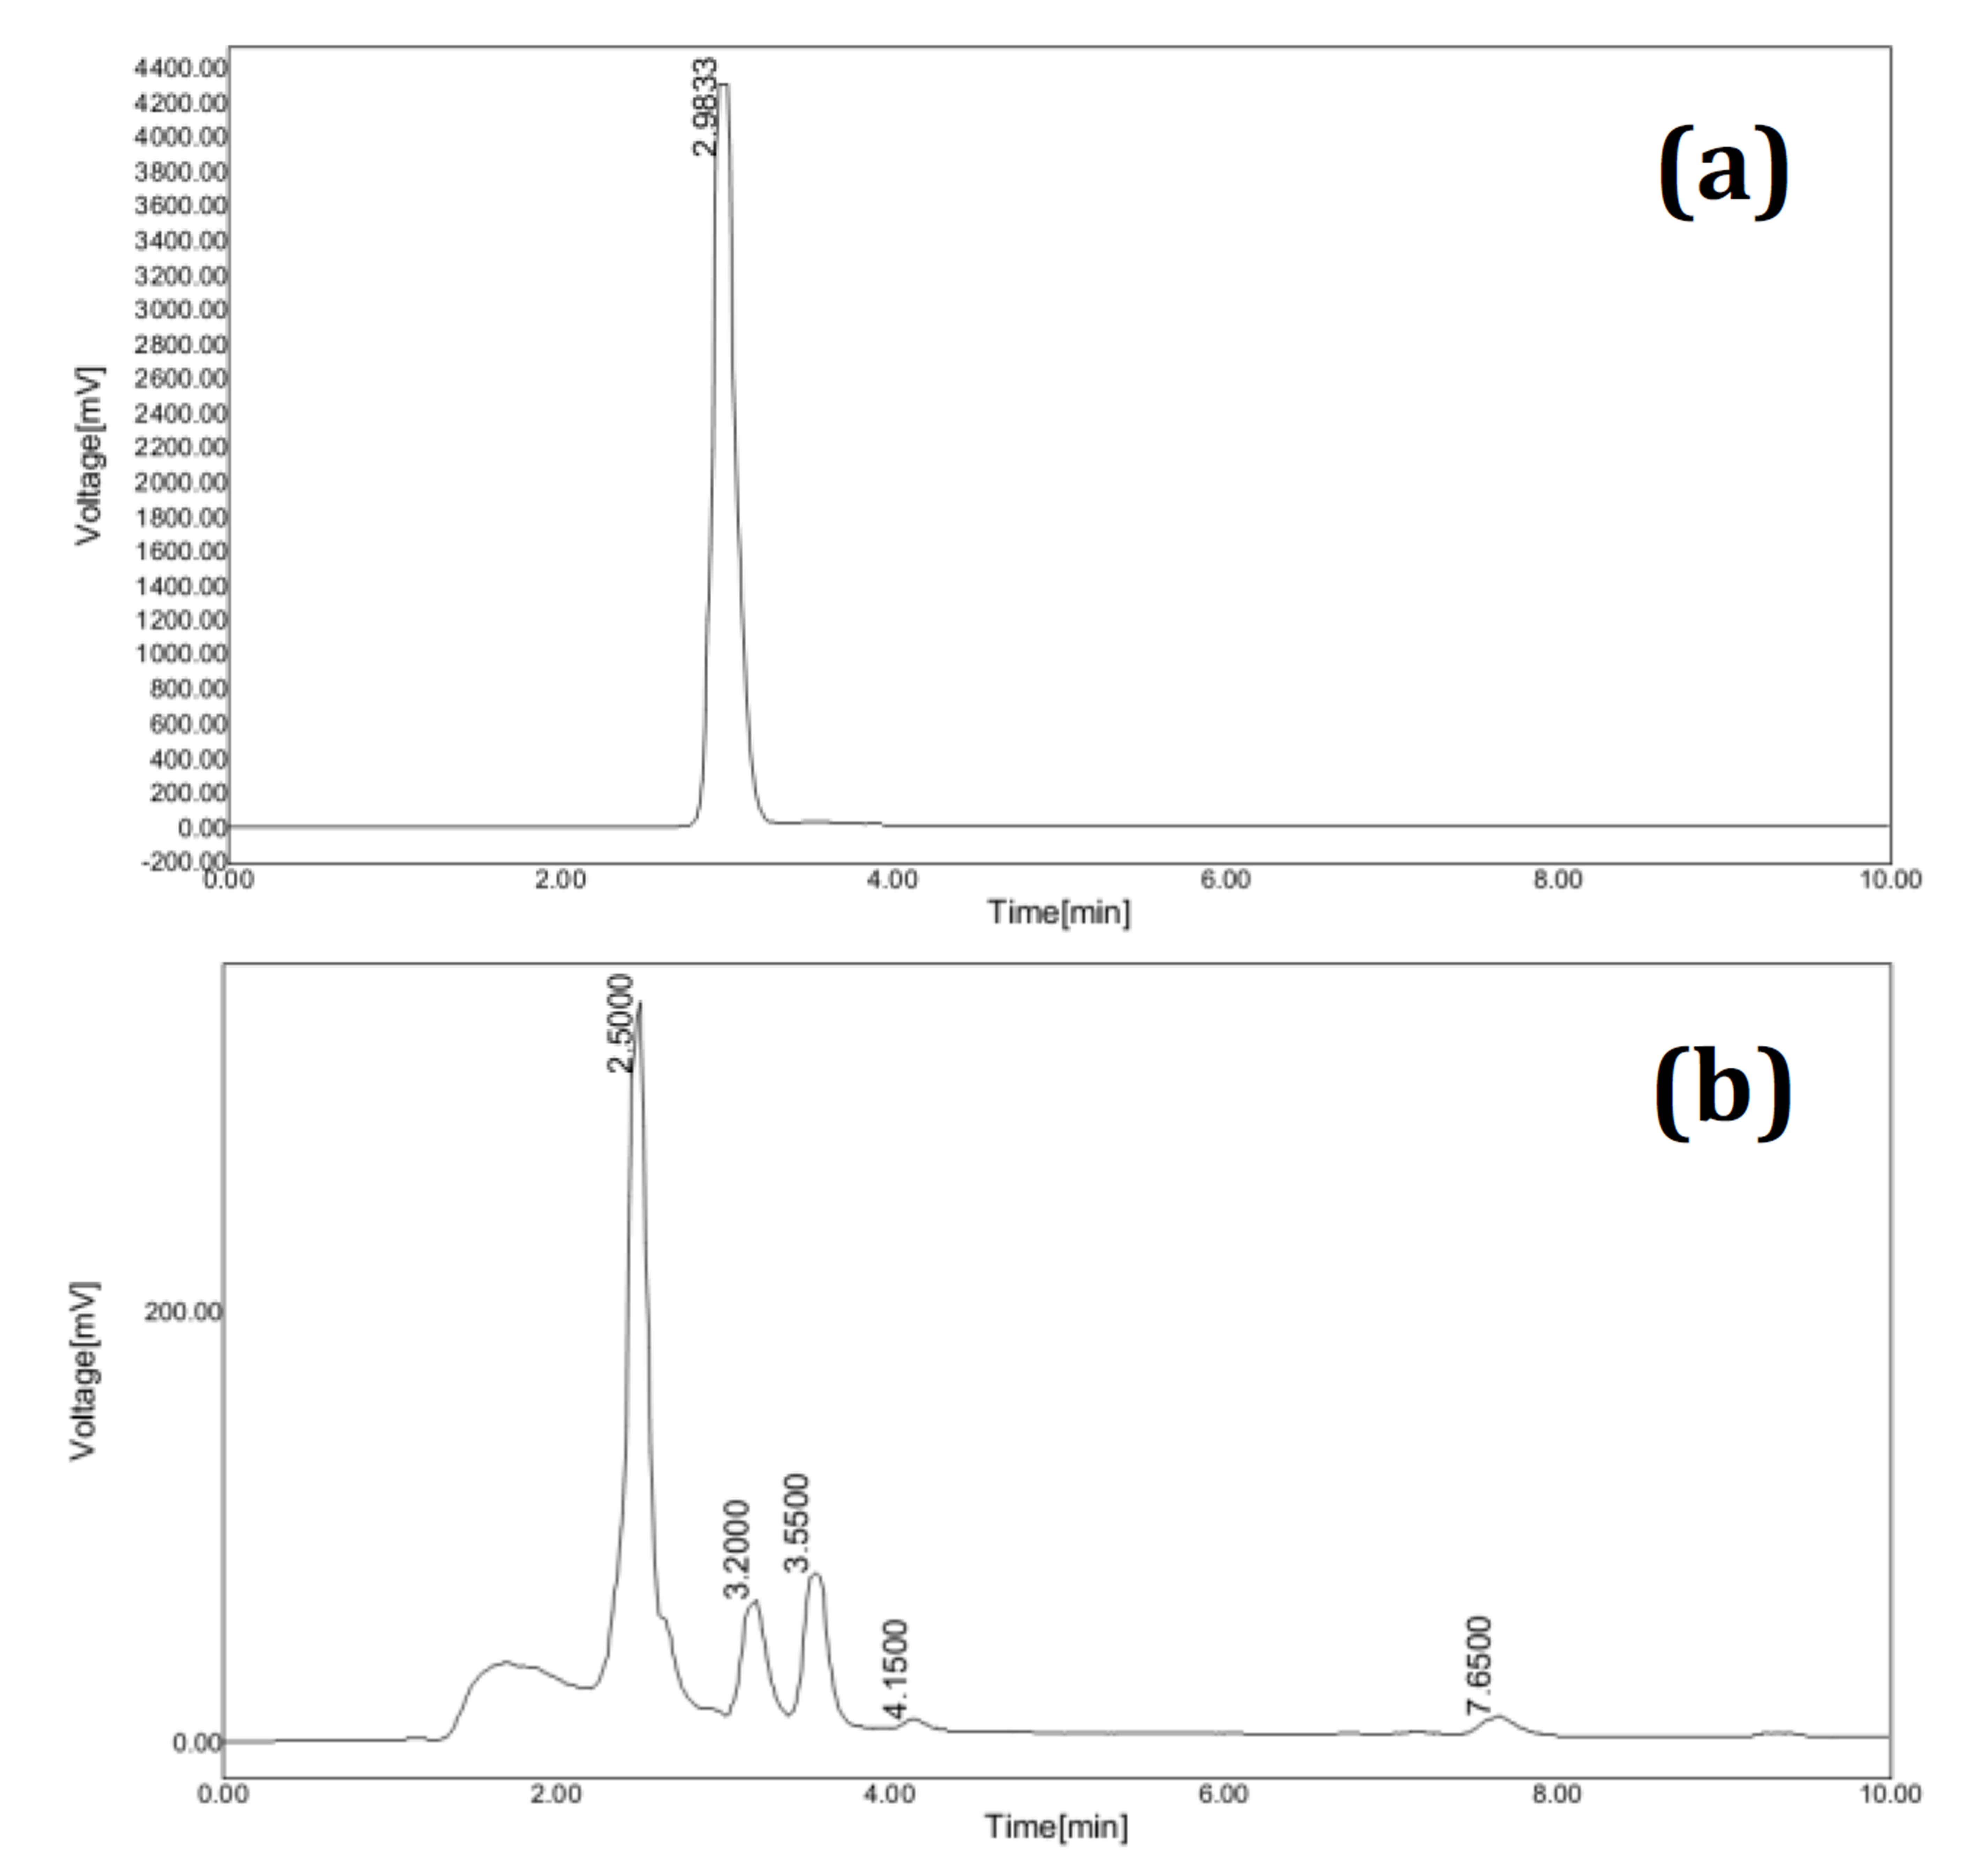
Figure 7. (a) HPLC chromatogram of Direct Orange 26 extracted at 0hr. (b) HPLC elution profile of degraded metabolites extracted at 6hr.
The HPLC chromatogram after azo dye degradation showed a major peak at 2.50 min and minor multiple peaks were observed at 3.20, 3.55, 4.15 and 7.65 min respectively. HPLC chromatogram of biodegraded sample is shown in Fig. 7b. Biodegradation of DO-26 by B. mojavensis strain ABR is indicated by the absence of dye peak and the emergence of multiple peaks at different retention times.
Table 1. Phytotoxicity comparison of DO-26 and its extracted metabolites.
|
Parameters |
Vigna mungo |
Sorghum bicolor |
Vigna radiata |
|
||||||||||||||
|
Water |
DO-26 (100 ppm) |
Extracted metabolites (100 ppm) |
Water |
DO-26 (100 ppm) |
Extracted metabolites (100 ppm) |
Water |
DO-26 (100 ppm) |
Extracted metabolites (100 ppm) |
|
|||||||||
|
Germination (%) |
100 |
30 |
100 |
100 |
20 |
100 |
100 |
20 |
100 |
|||||||||
|
Shoot (cm) |
9.02±0.13 |
2.13±0.2** |
7.14±0.47* |
8.66±0.69 |
2.14±0.14** |
6.34±0.69* |
10.23±0.56 |
1.89±0.61** |
7.36±0.34 |
|||||||||
|
Root (cm) |
3.04±0.15 |
00.35±0.13** |
2.04±0.20 |
3.46±0.11 |
0.62±0.12** |
2.50±0.19 |
4.12±0.19 |
0.88±0.13** |
2.40±0.34* |
|||||||||
Values are mean of three experiments ± SEM, significantly different from the control (seeds germinated in water) at *P< 0.05, **P< 0.01, by one-way analysis of variance (ANOVA) with Tukey–Kramer comparison test.
The purpose of LC-MS analysis is to identify the intermediates produced from the degradation process. The degradation of DO-26 dye is clearly confirmed by comparing the LC-MS chromatograms of DO-26 dye and its degraded sample which are represented in Fig. S1 and Fig. S2 (see supporting information). LC-MS analysis of the dye and their degraded product confirmed degradation of Direct Orange 26 by Bacillus mojavensis ABR. The retention times of all degradation products are in the range of 8.61 – 13.65 which are different from the retention time of control dye Direct Orange 26 at 6.71. These data clearly show the biodegradation of Direct Orange 26 azo dye by Bacillus mojavensis strain ABR.
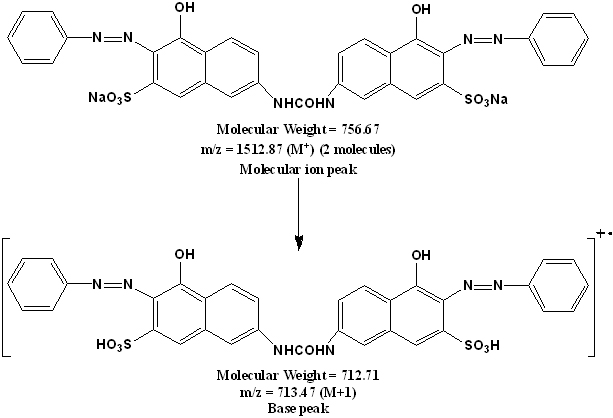
Figure 8. Proposed mass fragmentation pattern of Direct Orange 26 dye.
The chemical structure of the Direct Orange 26 dye (Fig. 1) is confirmed through LC-MS spectral analysis. Direct Orange 26 dye showed a single peak in the LC-MS chromatogram at a retention time of 6.71 min. The molecular ion peak appeared at m/z 1512.87 (for two molecules) and the base appeared peak at m/z 713.47 in the LC-MS spectrum which confirms the chemical structure of the Direct Orange 26 dye (Fig. 8).
The peak present in the LC-MS chromatogram of the DO-26 dye was absent in the chromatogram of degraded products and the retention time of degraded products are in the range of 8.61-13.65 minutes which are entirely different from the retention time of DO-26 dye which is at 6.71 min. This significant change in the retention times indicates that the azo dye (DO-26) has been degraded to low molecular fragments by the strain ABR. Furthermore, the high intense peaks in the LC-MS spectra of Direct Orange 26 dye degraded product with molecular mass of 453, 471, 227 and 279 shows a prominent deviation when compared with the high intense molecular masses (713 and 735) in the LC-MS spectrum of DO-26 dye. The difference in the retention time of peaks of Direct Orange 26 dye and its degraded product in the LC-MS chromatographs and the fragmented peaks in the LC-MS spectra confirms the degradation of Direct Orange 26 dye by Bacillus mojavensis strain ABR.
Phytotoxicity Study
The untreated dyeing effluents have direct and serious effects on the environment as well as soil fertility. The seeds of V. mungo, S. bicolor and V. radiate were tested against the azo dye Direct Orange 26 and its degraded metabolites at a concentration of 100 ppm. DO-26 treated seeds exhibited low germination percentage in V. mungo (30%), S. bicolor (20%) and V. radiata (20%). 100% germination rate was recorded in all three seeds when treated with 100 ppm concentration of degraded metabolites of DO-26 and distilled water. The azo dye DO-26 was found to significantly affect the root and shoot length of the seeds compared to the metabolites after decolorization and degradation (Table 1). The phytotoxicity study clearly indicates the potential of Bacillus mojavensis strain ABR in degrading and detoxifying the azo dye Direct Orange 26 efficiently.
Conclusions
The present study determines the potential of Bacillus mojavensis strain ABR isolated from textile effluent to decolorize and degrade the azo dye Direct Orange 26 (DO-26). The acclimatized strain decolorized 100 mg L-1 DO-26 with 95% efficiency at pH 7, 37°C and in the presence of 5% NaCl within a short time span of 6 h. The strain ABR was able to degrade the dye DO-26 as detected by HPLC and LCMS by the formation of metabolites. Bacillus mojavensis ABR led to the successful detoxification of DO-26 being proved by the phytotoxicity test. Hence, Bacillus mojavensis strain ABR could be practically employed in decolorizing and degrading several of the complex Azo dyes and to effectively treat dyeing effluents.
Acknowledgements
The authors acknowledges the management of the VIT University, Vellore for providing necessary facilities. The authors would also like to acknowledge the assistance of Dr. V. S. V. Satyanarayana, IIT Mandi.
Notes and References
* Corresponding Author Details: A. S. Arun Prasad, Division of Environmental Biotechnology, School of Biosciences and Technology, VIT University, Vellore, India.
E-mail id.: This email address is being protected from spambots. You need JavaScript enabled to view it.
† Supporting Information (SI) available: [LC-MS Spectra].
1. I. O. Asia, N. A. Oladoja and E. E. Bamuza-pemu, African Journal of Biotechnology, 2006, 5, 1678.
2. G. Tchobanoglous and F. L. Burton, Wastewater Engineering: Treatment, Disposal and Reuse/Metcalf and Eddy, (Tata McGraw-Hill Publishing Company Limited: New Delhi, India), 1995.
3. B. S. Andre dos, J. C. Francisco and B. L. Jules van, Bioresource Technol., 2007, 98, 2369.
4. A. M. Talarposhti, T. Donnelly and G. K. Anderson, Water Res., 2001, 35, 425.
5. A. B. Dos Santos, I. A. E. Bisschops and F. J. Cervantes, Closing process water cycles and product recovery in textile industry: perspective for biological treatment. F. J. Cervantes, A. C. Van Haandel and S. G. Pavlostathis (ed.) (Advanced Biological Treatment Processes for Industrial Wastewaters, Vol. 1. International Water Association: London), 2006, p. 298.
6. Environmental Protection Agency. Profile of the Textile Industry (Washington: EPA), 1997.
7. J. S. Chang, C. Chou and S. Y. Chen, Water Sci. Technol., 2001, 43, 261.
8. U. Meyer, Biodegradation of synthetic organic colorants. Microbial degradation of xenobiotic and recalcitrant compounds. T. Leisinger, A. M. Cook, R. Hunter, J. Nuesch, (ed.) (FEMS symposium 12, Academic Press: London), 1981, p. 371.
9. H. Zollinger, Colour Chemistry-Synthesis, Properties of Organic Dyes and Pigments, (VCH Publishers: New York, USA), 1987, p. 92.
10. J. T. Spadary, L. Isebelle and V. Renganathan, Indian J. Biotech., 1994, 1, 393.
11. F. He, W. Hu and Y. Li, Chemosphere, 2004, 57, 293.
12. M. S. Reish, Chem. Eng. News Jan., 1996, 15, 10.
13. P. Verma and D. Madamwar, World J. Microbiol. Biotech., 2003, 19, 615.
14. I. M. Banat, P. Nigam, D. Singh and R. Marchant, Bioresource Technol., 1996, 58, 217S.
15. T. Robinson, G. McMullan, R. Marchant and P. Nigam, Bioresource Technol., 2000, 77, 247.
16. H. Chen, R. F. Wang and C. E. Cerniglia, Protein Exp. Purif., 2004, 34, 302.
17. K. Kumar, S. S. Devi, K. Krishnamurthi, S. Gampawar, N. Mishra, G. H. Pandya and T. Chakrabarti, Bioresource Technol., 2006, 97, 407.
18. J. P. Jadhav, G. K. Parshetti, S. D. Kalme and S. P. Govindwar, Chemosphere, 2007, 68, 394.
19. F. P. Van der Zee and S. Villaverde, Water Res., 2005, 39, 1425.
20. P. Kaushik and A. Malik, Environ. Int., 2009, 35, 127.
21. A. Pandey, P. Singh and L. Iyengar, Int. Biodeter. Biodegrad., 2007, 59, 73.
22. E. Forgacs, T. Cserhati and G. Oros, Environ. Int., 2004, 30, 953.
23. M. F. Coughlin, B. K. Kinkle and P. L. Bishop, Chemosphere, 2002, 46, 11.
24. G. Buitron, M. Quezada and G. Moreno, Biores.Technol., 2004, 92, 143.
25. K. Sarayu and S. Sandhya, Appl. Biochem. Biotechnol., 2010, 160, 1241.
26. S. F. Attschul, T. L. Madden, A. A. Schaffer, J. Zhang, Z. Zhang, W. Miller and D. J. Lipman, Nucleic Acids Res., 1997, 25, 3389.
27. J. D. Thompson, T. J. Gibson, F. Plewniak, F. Jeanmougin and D. G. Higgins, Nucleic Acids Res., 1997, 24, 4876.
28. K. Tamura, D. Peterson, N. Peterson, G. Stecher, M. Nei and S. Kumar, Mol. Biol. Evol., 2011, May 4, 1.
29. J. Sambrook, E. F. Fritsch and T. Maniatis, Molecular cloning: a laboratory manual (2nd ed.) (Cold Spring Harbor Laboratory, Cold Spring Harbor: NY), 1999.
30. C. I. Pearcea, J. R. Lloydb and J. T. Guthriea, Dyes Pigments, 2003, 58, 179.
31. A. S. Arun Prasad and K. V. Bhaskara Rao, Appl. Microbiol. Biotechnol., 2013, 97, 7469.
32. G.Y. Lv, J. H. Cheng, X. Y. Chen, Z. F. Zhang and L. F. Fan, Bioresour. Technol., 2013, 144, 275.
33. D. Cetin and G. Donmez, Enzyme Microb. Tech., 2006, 38, 926.
34. T. Panswad and W. Luangdilok, Water Res., 2000, 34, 4177.
35. A. Zilly, C. M. J. Da Silva, A. Bracht, C. G. Marques de Souza, A. E. Carvajal, E. A. Koehnlein and R. M. Peralta, Int. Biodeter. Biodegrad., 2011, 65, 340.
36. Z. W. Wang, J. S. Liang and Y. Liang, Int. Biodeter. Biodegrad., 2013, 76, 41.